Fig. 2
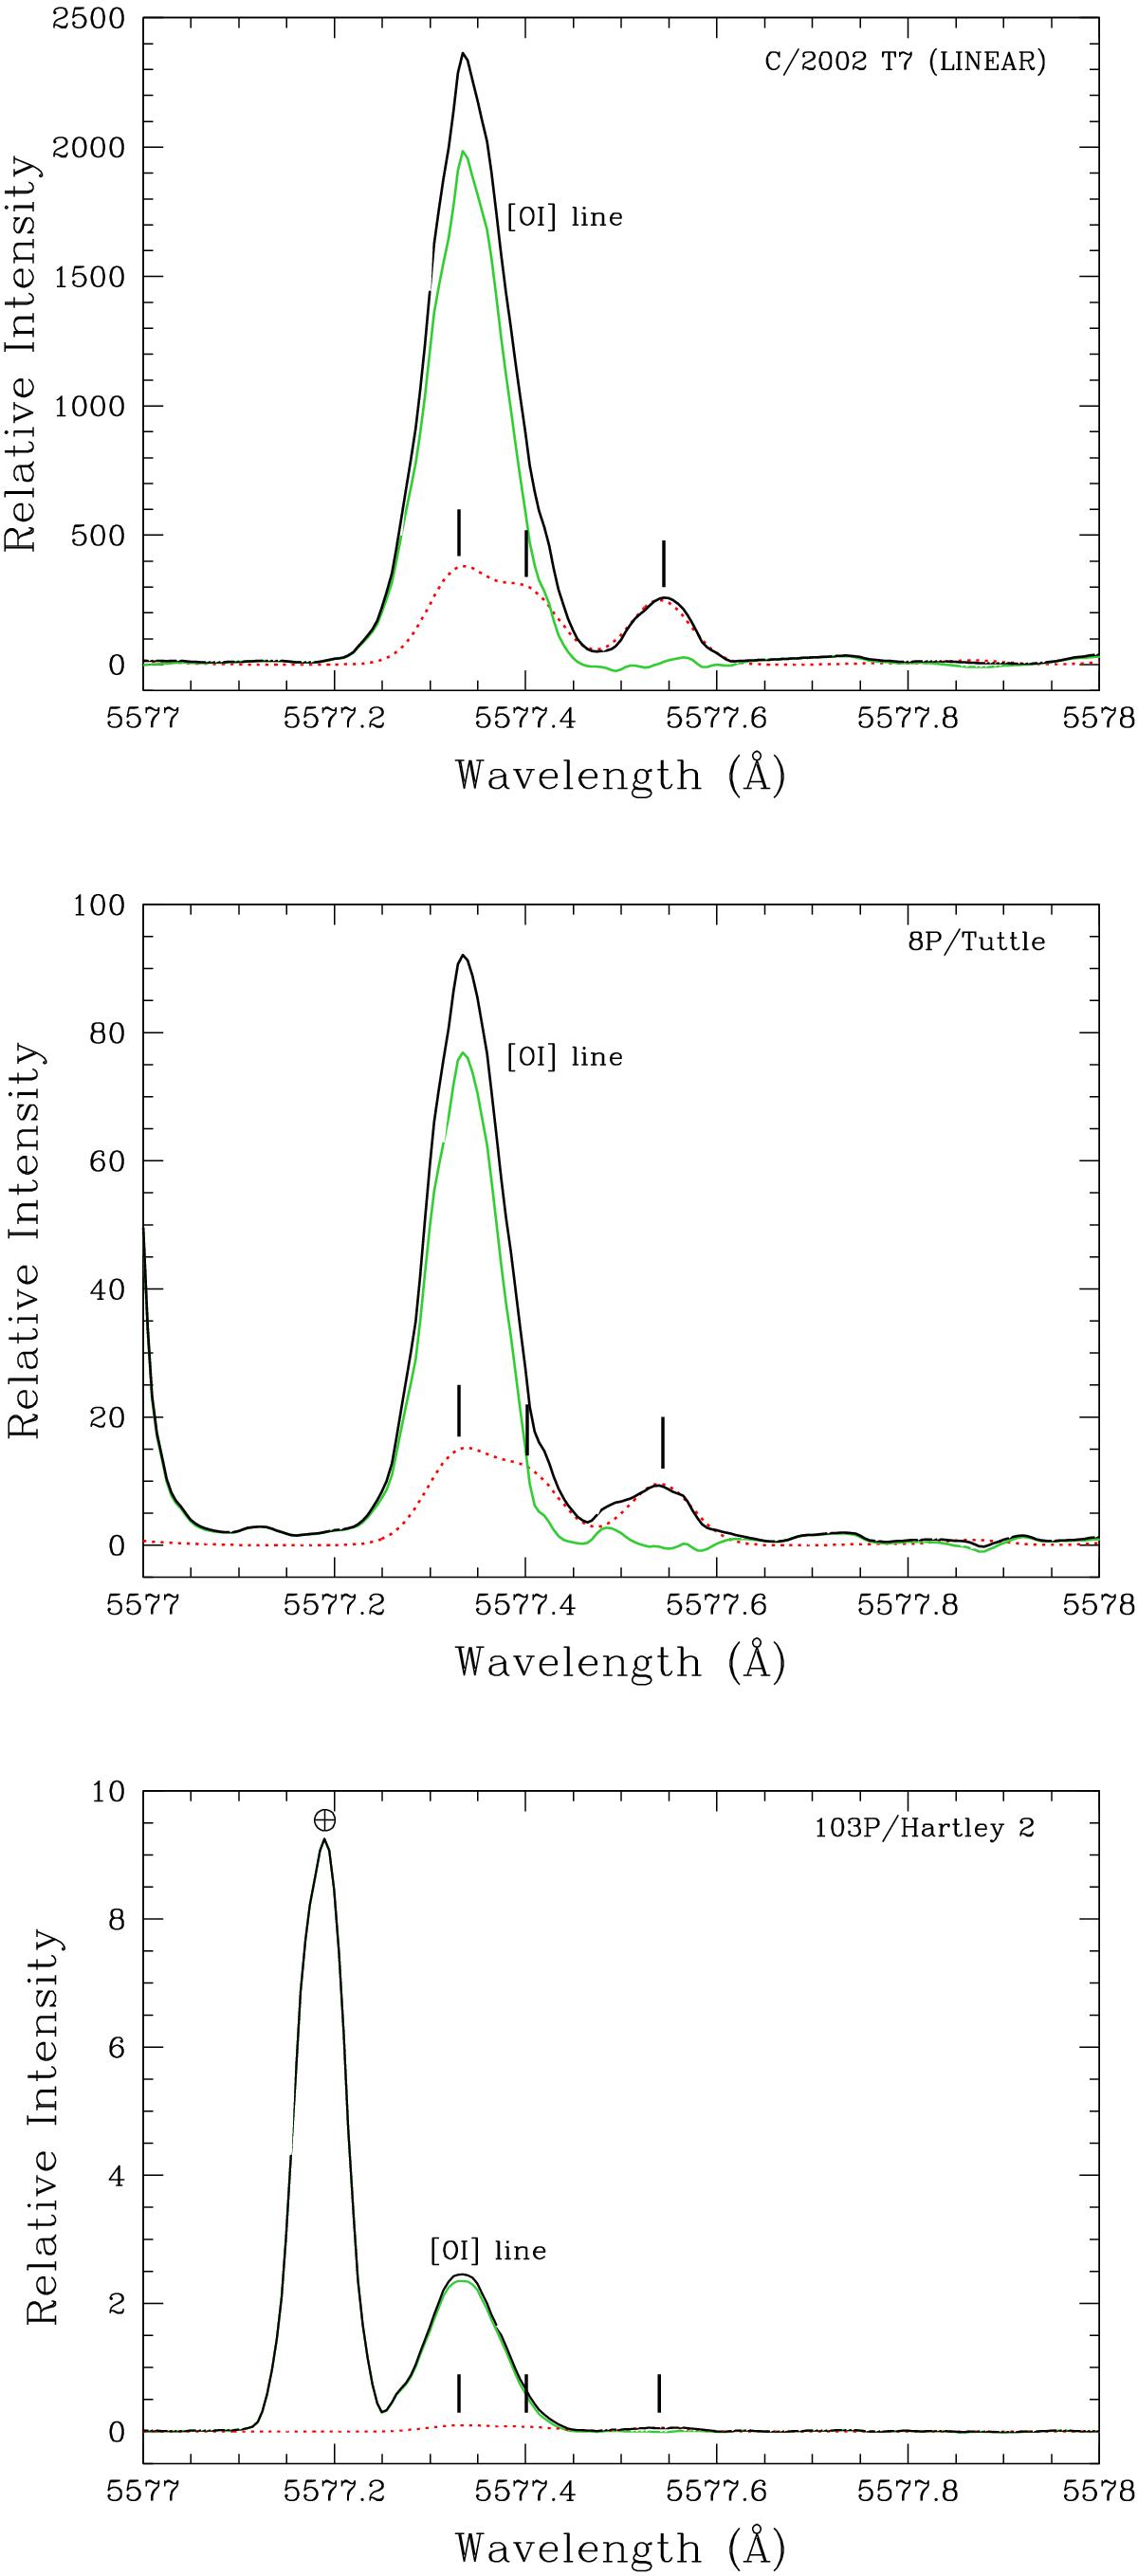
Subtraction of C2 lines from the spectra of comets C/2002 T7 (LINEAR), 8P/Tuttle and 103P/Hartley 2. The black spectrum shows the data not corrected for C2 while in the green one is after removing the C2 lines contamination. The C2 synthetic spectrum is represented by the dotted red line. The positions of C2 lines at 5577.331 Å, 5577.401 Å and 5577.541 Å are indicated with small vertical thick marks. The telluric [OI] line (⊕) is visible in the spectrum of comet 103P/Hartley 2.
Current usage metrics show cumulative count of Article Views (full-text article views including HTML views, PDF and ePub downloads, according to the available data) and Abstracts Views on Vision4Press platform.
Data correspond to usage on the plateform after 2015. The current usage metrics is available 48-96 hours after online publication and is updated daily on week days.
Initial download of the metrics may take a while.