Fig. 10
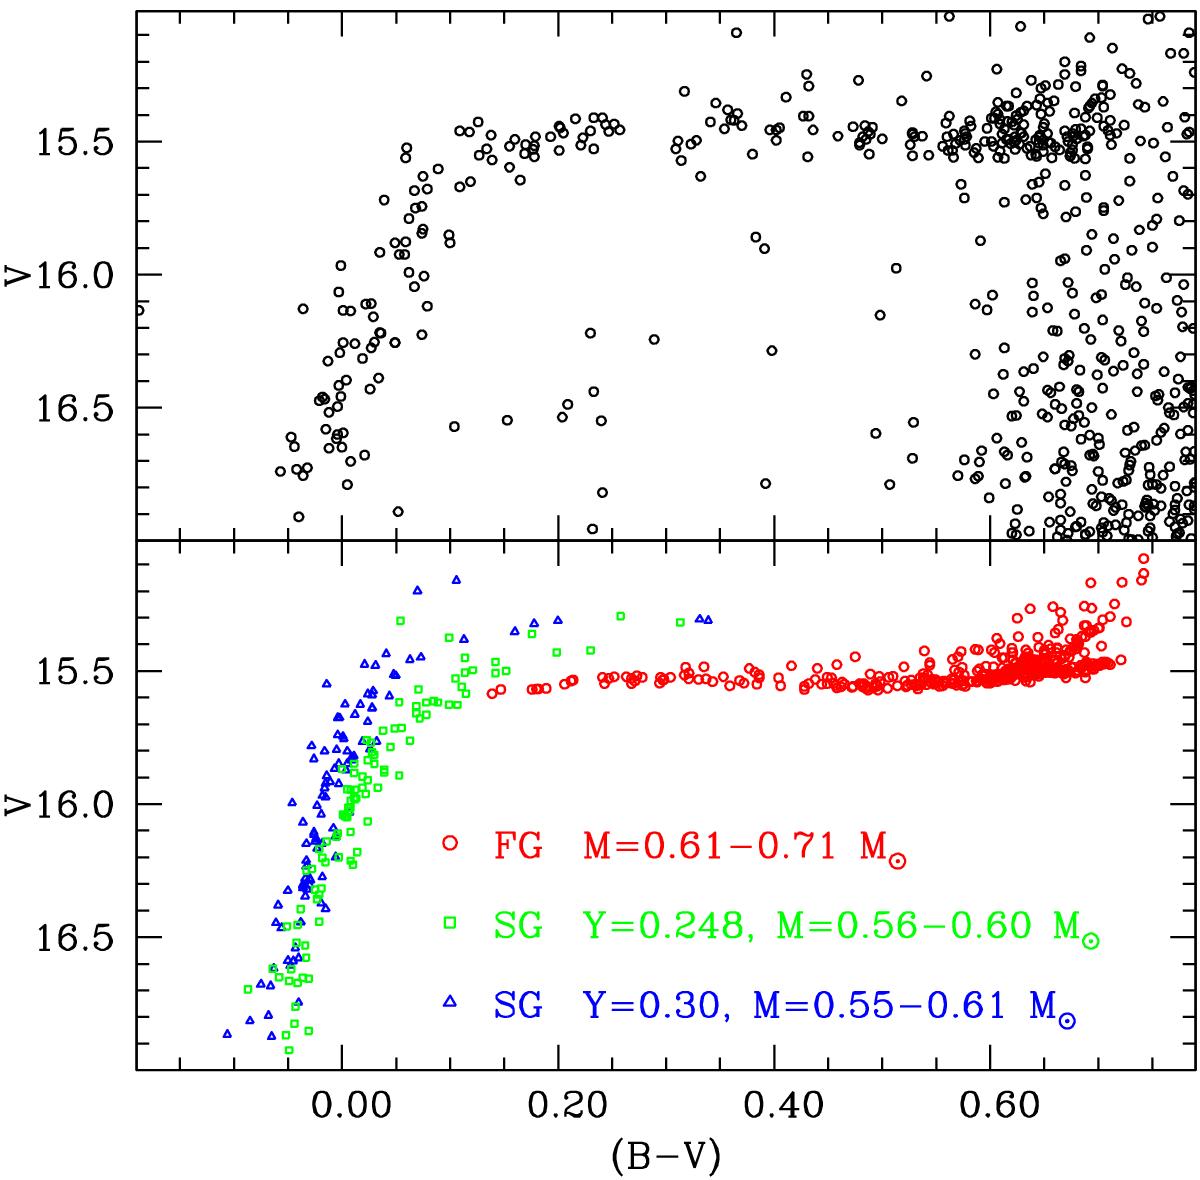
Comparison between a synthetic (lower panel) and an observed (upper panel) colour−magnitude diagram for the horizontal branch of NGC 6723. In the lower panel, red circles are FG (Y = 0.248) stars (mass range 0.61−0.71 M⊙), while green squares and blue triangles are SG with different values of the He abundance: Y = 0.248 and Y = 0.30. The mass range for the SG stars is 0.55−0.61 M⊙ in the first case and 0.56−0.60 M⊙ in the second.
Current usage metrics show cumulative count of Article Views (full-text article views including HTML views, PDF and ePub downloads, according to the available data) and Abstracts Views on Vision4Press platform.
Data correspond to usage on the plateform after 2015. The current usage metrics is available 48-96 hours after online publication and is updated daily on week days.
Initial download of the metrics may take a while.