Fig. 2
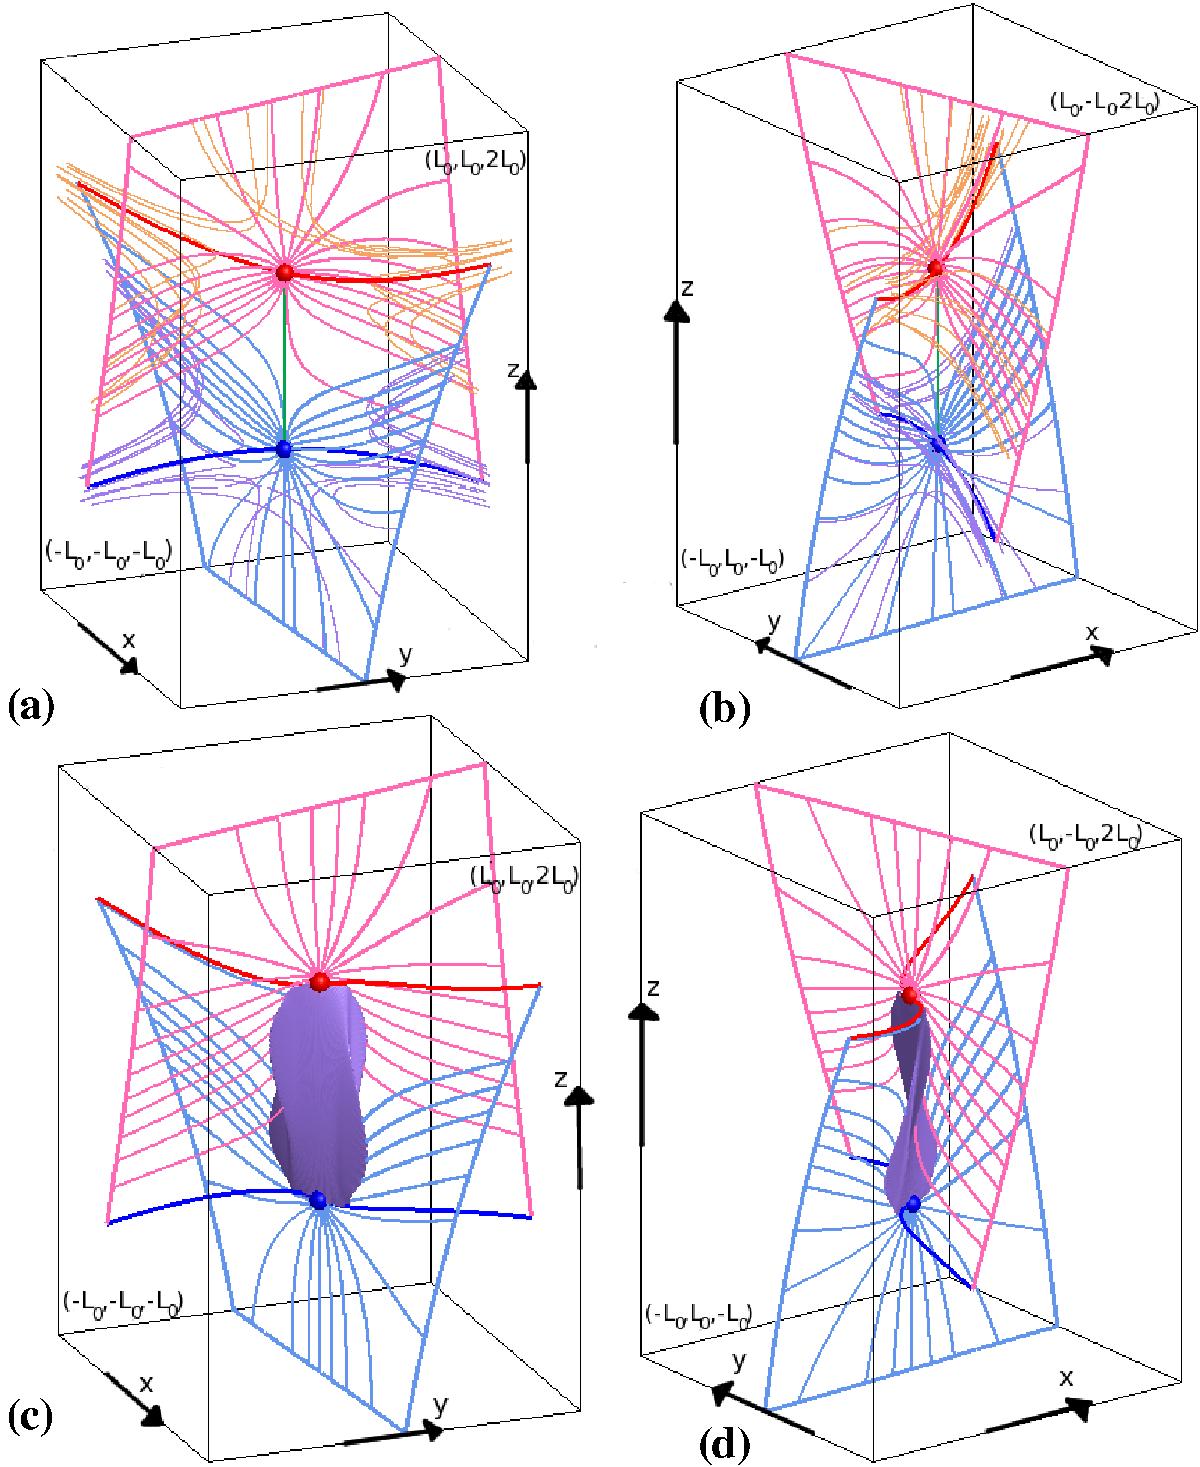
The magnetic skeleton of the initial field (a) and b)) and the final equilibrium field (c) and d)) viewed from two different angles showing the lower/upper nulls – blue/red spheres, spines – thick blue/red lines, separatrix-surface field lines – pale-blue/pink lines and separator – thick green line. General field lines are drawn around the lower/upper initial null’s spines (lilac/orange). The pale-blue/pink thick lines indicate where the separatrix surfaces from the lower/upper nulls intersect the boundaries of the domain. The equilibrium plots (c) and d)) include an isosurface (purple) of the parallel current drawn at 20% of the maximum value in the equilibrium field.
Current usage metrics show cumulative count of Article Views (full-text article views including HTML views, PDF and ePub downloads, according to the available data) and Abstracts Views on Vision4Press platform.
Data correspond to usage on the plateform after 2015. The current usage metrics is available 48-96 hours after online publication and is updated daily on week days.
Initial download of the metrics may take a while.