Fig. 11
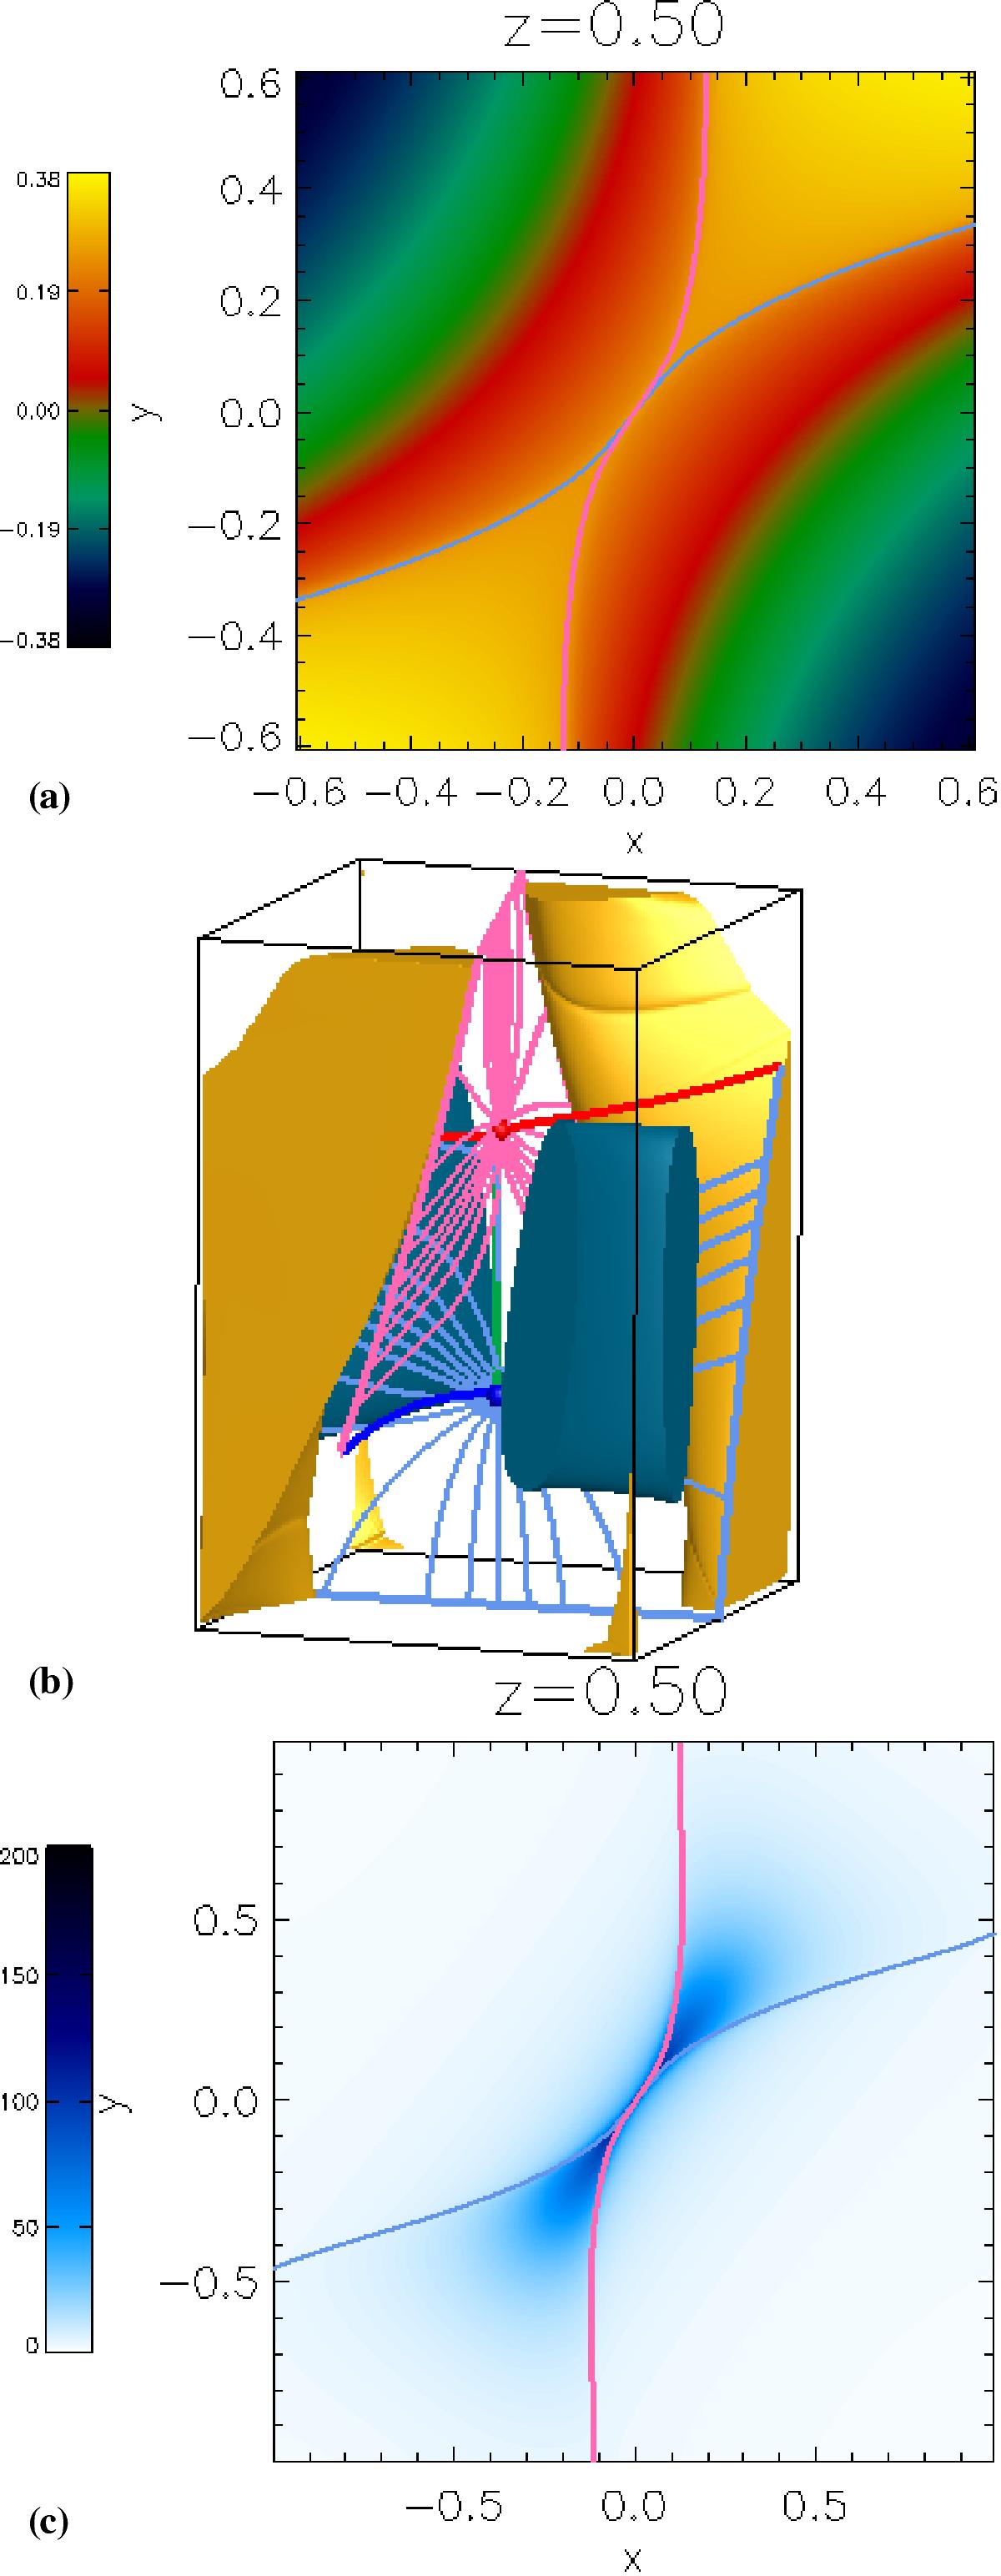
Contours of a) the pressure difference (p − p0) in the z = 0.5 plane of the final equilibrium and b) the 3D skeleton of this field with yellow/blue isosurfaces of pressure difference (p − p0) drawn at 95% of the maximum positive/negative value. c) The plasma beta in the final equilibrium state in the plane z = 0.5. The pale-blue/pink lines indicate where the separatrix surfaces from the lower/upper nulls intersect the plane.
Current usage metrics show cumulative count of Article Views (full-text article views including HTML views, PDF and ePub downloads, according to the available data) and Abstracts Views on Vision4Press platform.
Data correspond to usage on the plateform after 2015. The current usage metrics is available 48-96 hours after online publication and is updated daily on week days.
Initial download of the metrics may take a while.