Free Access
Fig. 1
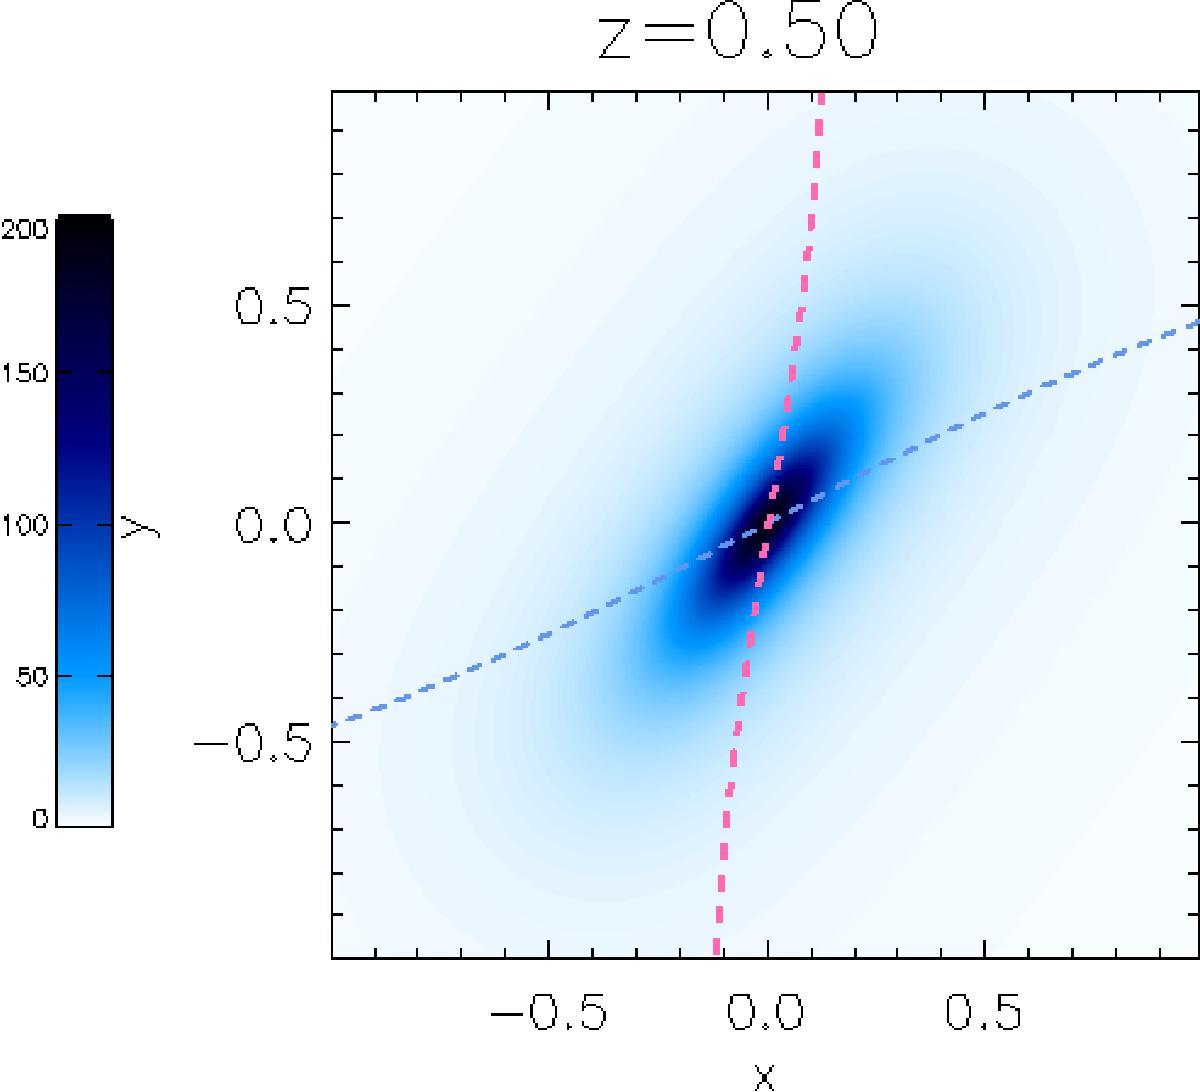
Contour plot of the initial plasma beta in a cut perpendicular to the z-axis (separator) at z = 0.5 for the main experiment with jsep = 1.5. Over plotted are the intersections of the lower and upper null’s separatrix surfaces with the z = 0.5 plane in the initial state (pale-blue/pink dashed lines, respectively).
Current usage metrics show cumulative count of Article Views (full-text article views including HTML views, PDF and ePub downloads, according to the available data) and Abstracts Views on Vision4Press platform.
Data correspond to usage on the plateform after 2015. The current usage metrics is available 48-96 hours after online publication and is updated daily on week days.
Initial download of the metrics may take a while.