Fig. 5
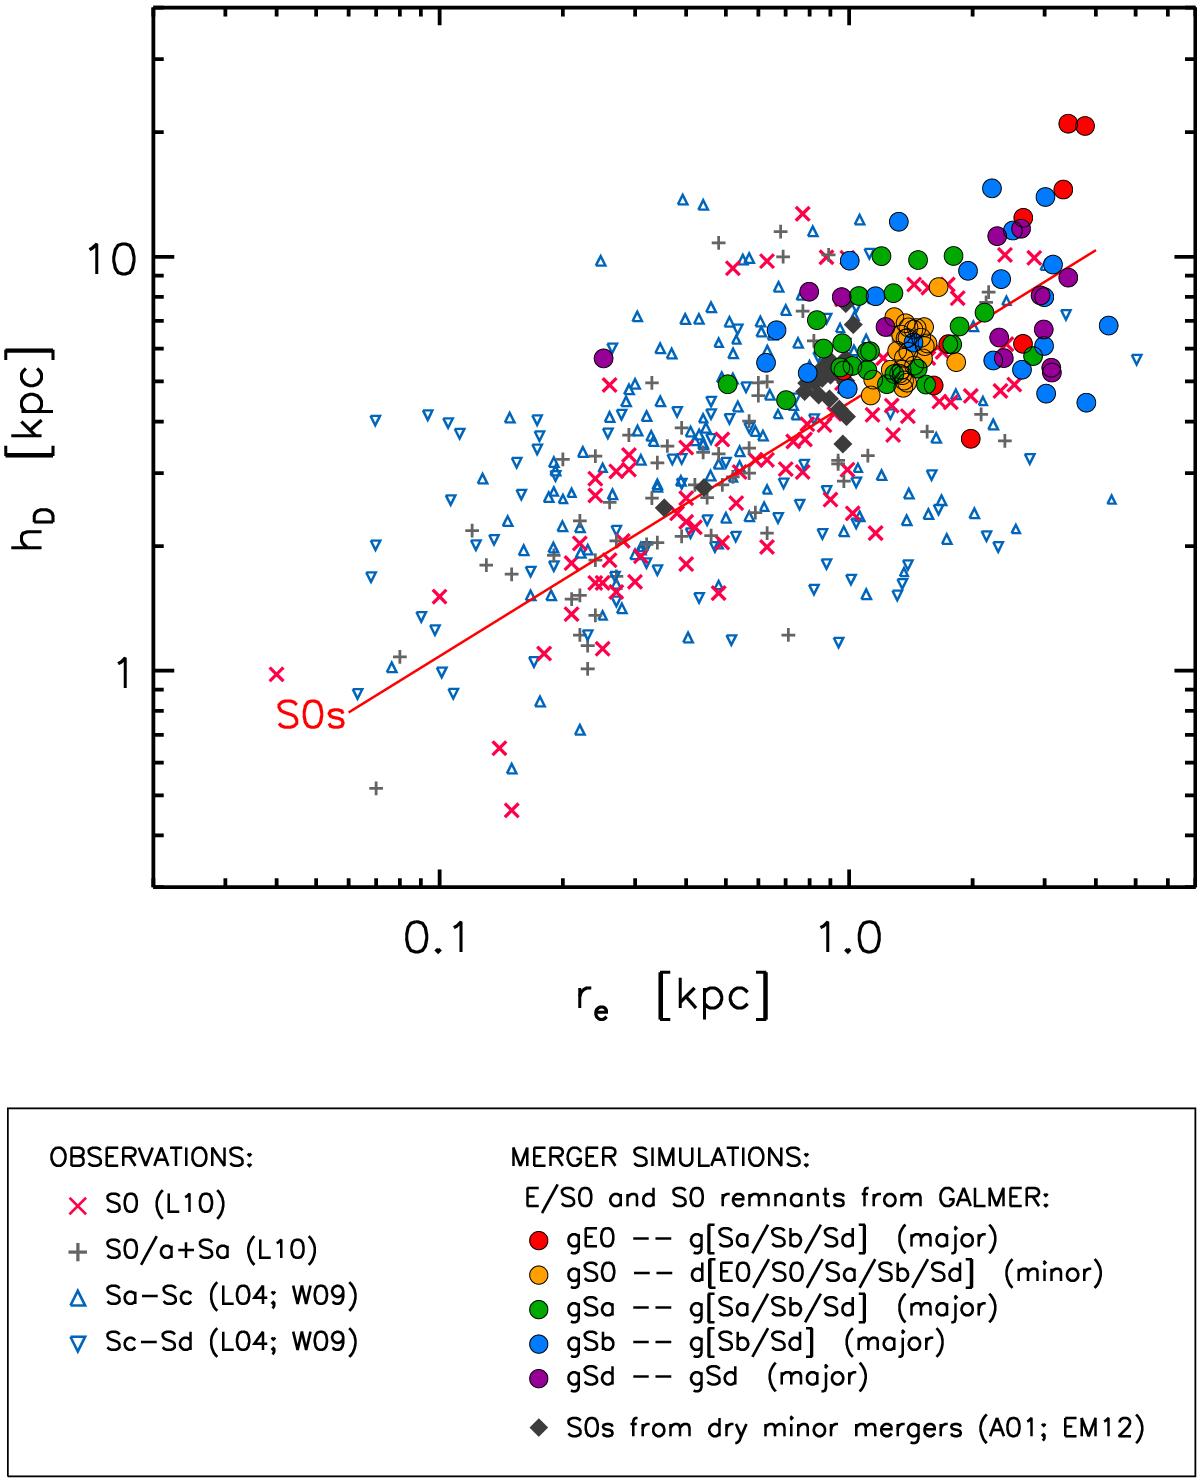
Location of our S0-like remnants in the log (hd)-log (re) plane, compared to the observational results (L04; W09; L10) and previous simulations of dry minor mergers (A01; EM06; EM12; EM13). Details on the symbols and colour-coding used can be found on the legend. The linear fits performed to the observational distributions of S0 and spiral galaxies are overplotted in the diagram with solid lines only when Pearson’s correlation coefficient is greater than 0.5, in this case only for S0s (ρS0 = 0.59, ρSp = 0.21). (A colour version is available in the electronic edition.)
Current usage metrics show cumulative count of Article Views (full-text article views including HTML views, PDF and ePub downloads, according to the available data) and Abstracts Views on Vision4Press platform.
Data correspond to usage on the plateform after 2015. The current usage metrics is available 48-96 hours after online publication and is updated daily on week days.
Initial download of the metrics may take a while.