Fig. 3
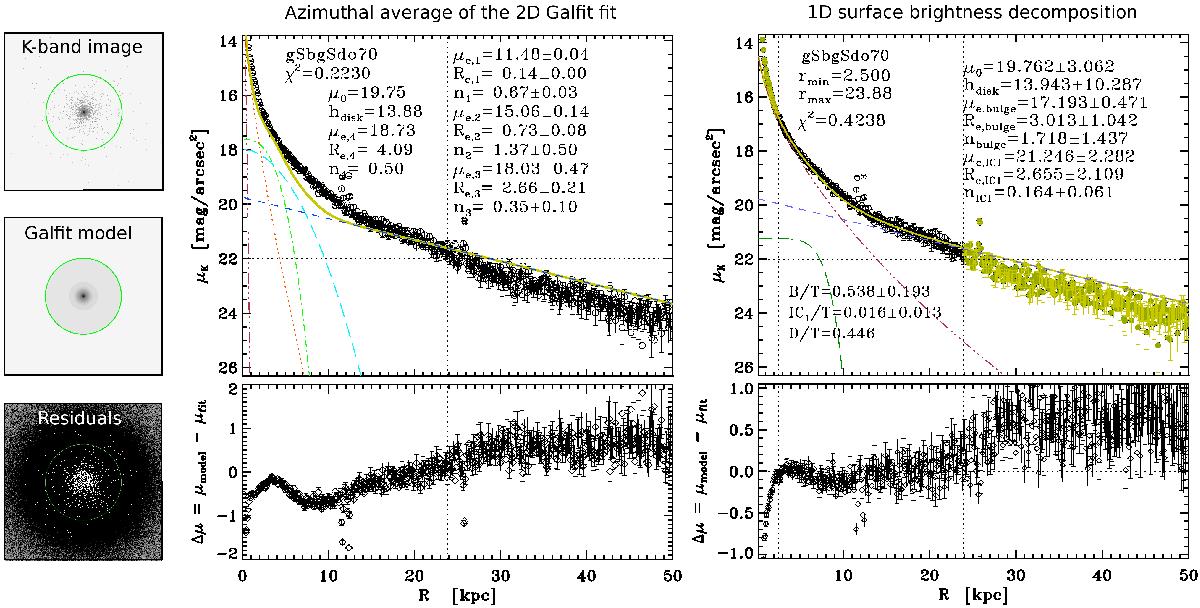
Comparison between the best GALFIT multi-component decomposition of the 2D K-band image of the remnant gSbgSdo70 and the corresponding 1D decomposition. Left panels: artificial K-band image of the remnant for a face-on view (top), 5-component model obtained with GALFIT (free of noise, middle), and residuals resulting from the subtraction of the model to the image (bottom). The same logarithmic greyscale is used in the two upper panels, whereas the linear greyscale in the bottom panel emphasises the background noise at the outskirts. The field of view corresponds to 100 kpc×100 kpc, and the green circle represents R = 25 kpc in the galaxy. Middle panels: azimuthal average of the GALFIT model (green solid line) compared to the 1D surface brightness profile (circles). The five axisymmetric Sérsic components required by the modelling are plotted in the top panel: a nuclear component (component 1, red dotted-dashed line), a thin inner disc with n = 1.37 (component 2, orange dotted line), a lense with n = 0.35 (component 3, green dotted-dashed line), a fixed extended lense component with n = 0.5 (component 4, light blue long-dashed line), and the outer exponential disc, fixed to the result obtained in the 1D fit (dark blue dashed line). The residuals are plotted as a function of radius in the bottom panel. Right panels: for comparison, 1D decomposition obtained fitting the azimuthally-averaged K-band surface brightness profile. The legend is the same as in Fig. 2. (A colour version is available in the electronic edition.)
Current usage metrics show cumulative count of Article Views (full-text article views including HTML views, PDF and ePub downloads, according to the available data) and Abstracts Views on Vision4Press platform.
Data correspond to usage on the plateform after 2015. The current usage metrics is available 48-96 hours after online publication and is updated daily on week days.
Initial download of the metrics may take a while.