Fig. 2
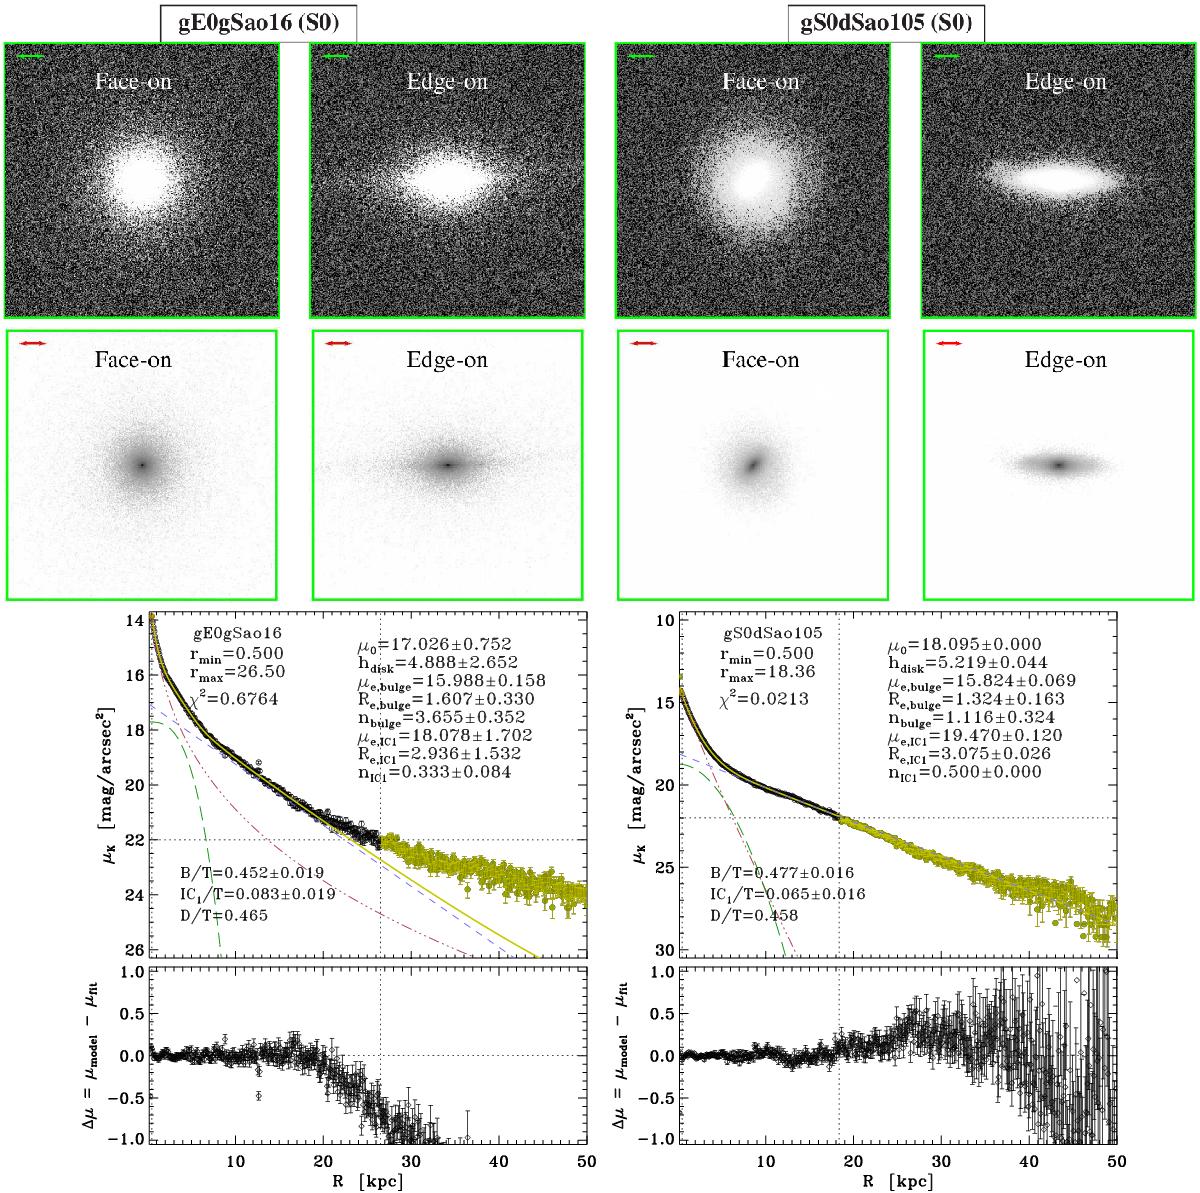
Simulated K-band images and radial surface brightness profiles of some S0-like remnants from our sample of major and minor mergers. The simulations assume D = 30 Mpc, μK,lim = 22 mag arcsec-2 for S/N = 3, and a spatial resolution of 0.7′′. First two rows of panels: simulated K-band images of the final remnants for face-on and edge-on views. The horizontal arrow at the top left of each panel represents a physical length of 5 kpc. The field of view is 50 kpc ×50 kpc. We have used different logarithmic greyscales to highlight the structure of the outer discs (first row of panels) or of the central bulges (second row of panels). Third row of panels: simulated radial K-band surface brightness profiles and multicomponent decompositions performed to them. Dotted horizontal line: limiting surface brightness of the images. Dotted vertical lines: minimum and maximum radii considered in the fit. Black empty circles: data considered in the fit. Green filled circles: data excluded from the fit. Red dotted-dashed line: fitted Sérsic bulge. Blue dashed line: fitted exponential disc. Green long-dashed line: additional Sérsic component required in the fit (representing components such as ovals, bars, lenses, or embedded inner discs). Solid light green line: total profile resulting from the fit. Fourth row of panels: residuals of the fits as a function of radial location in the galaxy. (A colour version is available in the electronic edition.)
Current usage metrics show cumulative count of Article Views (full-text article views including HTML views, PDF and ePub downloads, according to the available data) and Abstracts Views on Vision4Press platform.
Data correspond to usage on the plateform after 2015. The current usage metrics is available 48-96 hours after online publication and is updated daily on week days.
Initial download of the metrics may take a while.