Fig. 11
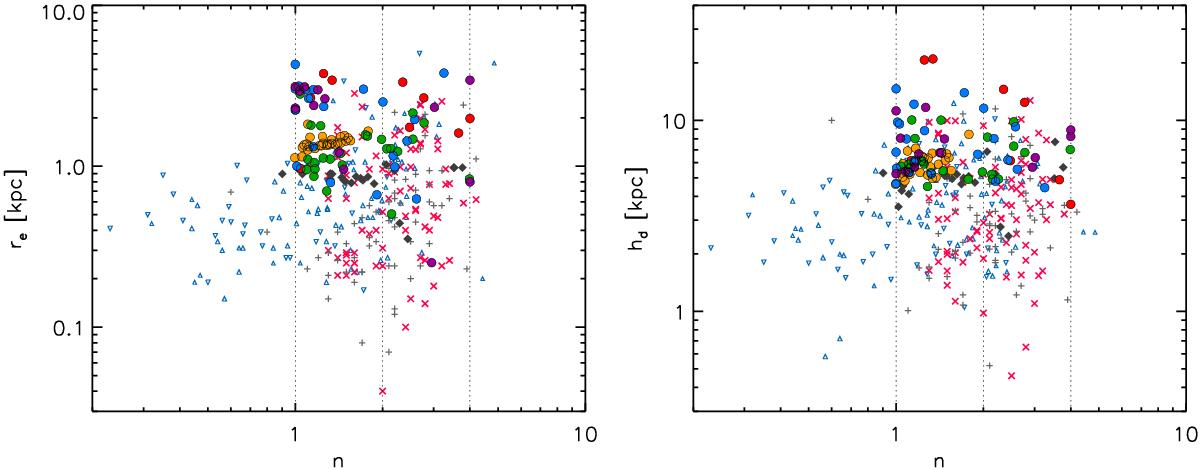
Distribution of our S0-like remnants in the log (re)-log (n) and log (hd)-log (n) planes (left and right panels, respectively), compared to the observational distributions of S0s and spirals (L04; W09; L10). The location of previous collisionless simulations of minor mergers is also shown (A01; EM06; EM12; EM13). The vertical dotted line indicates the location of n = 1, 2, and 4 in each diagram. The symbols represent the same models and observations as in the previous figures; consult the legend in Fig. 5. (A colour version is available in the electronic edition.)
Current usage metrics show cumulative count of Article Views (full-text article views including HTML views, PDF and ePub downloads, according to the available data) and Abstracts Views on Vision4Press platform.
Data correspond to usage on the plateform after 2015. The current usage metrics is available 48-96 hours after online publication and is updated daily on week days.
Initial download of the metrics may take a while.