Fig. 1
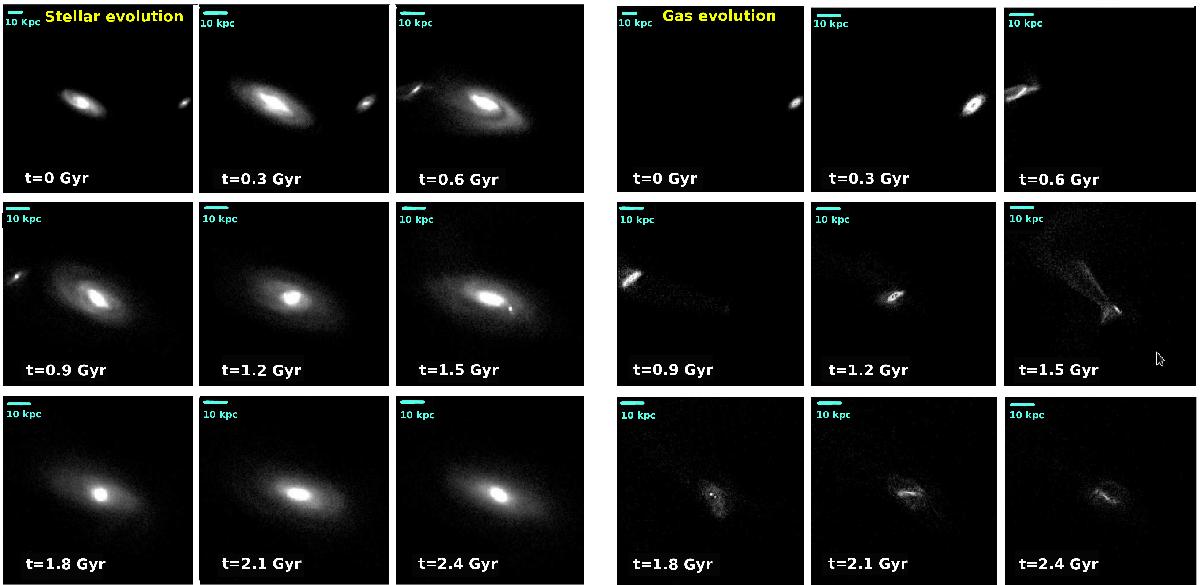
Time evolution of the stellar and gaseous material in the minor merger model gS0dSbo99 (left and right panels, respectively). Time is shown at the bottom left corner of each frame. At each snapshot, the line of sight has been set to θ = 30o and φ = −90o and nearly centred on the giant S0. The field of view has been increased in the frames corresponding to t = 0 to show the original location of the dSb satellite. In this experiment, only the dwarf galaxy contains gas at the start of the simulation. This simulation has been run for a total period of 3 Gyr. The snapshots have been obtained with the previewer of the GalMer database.
Current usage metrics show cumulative count of Article Views (full-text article views including HTML views, PDF and ePub downloads, according to the available data) and Abstracts Views on Vision4Press platform.
Data correspond to usage on the plateform after 2015. The current usage metrics is available 48-96 hours after online publication and is updated daily on week days.
Initial download of the metrics may take a while.