Free Access
Fig. 7
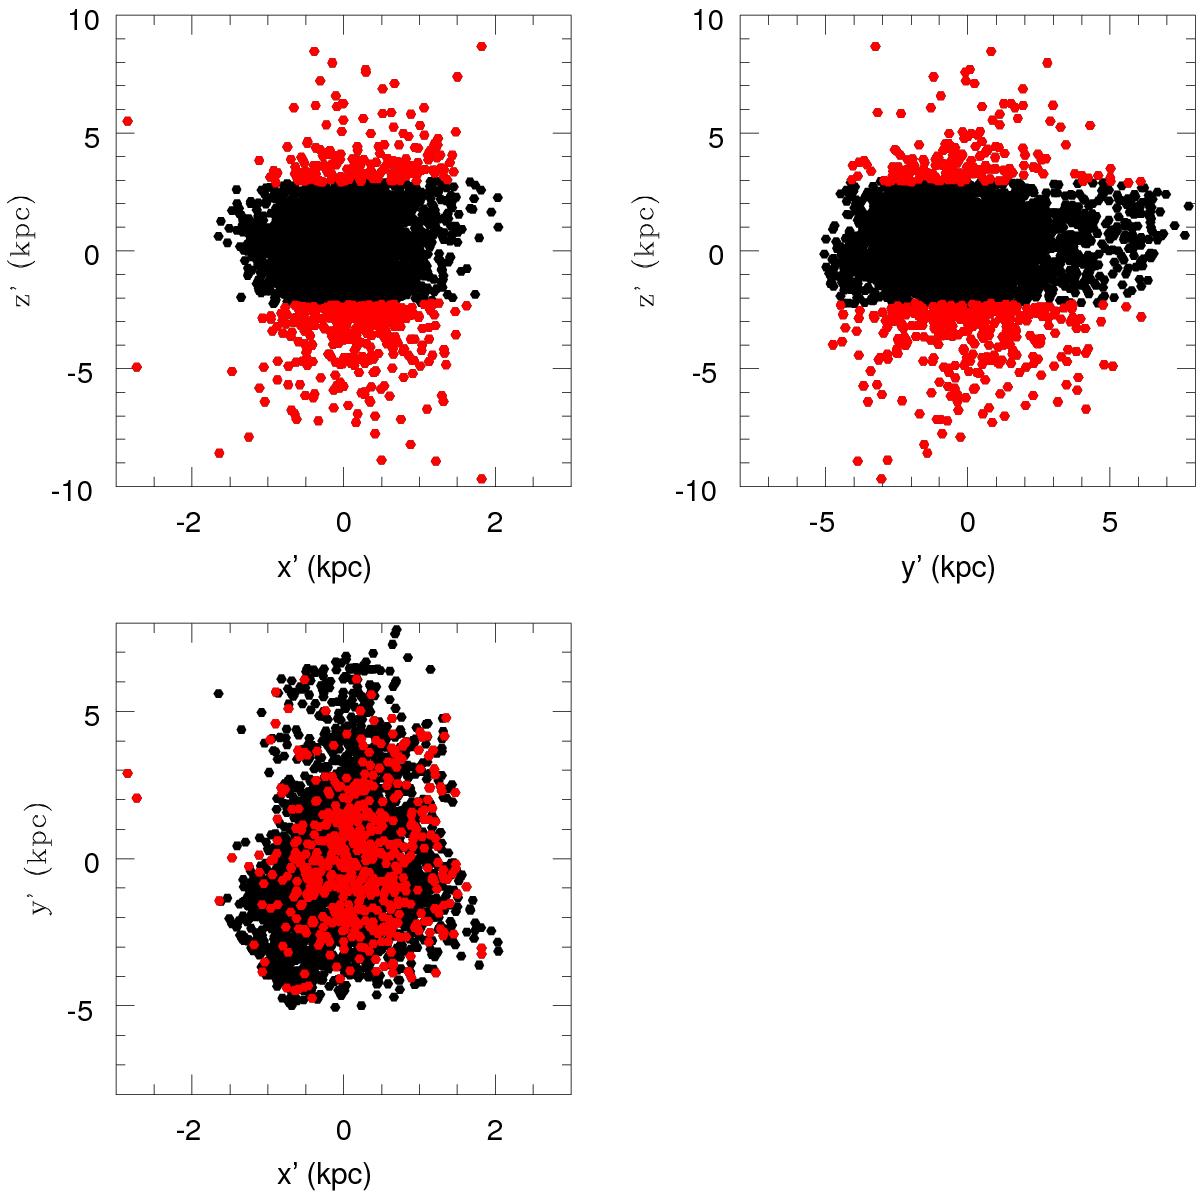
x′ − y′,x′ − z′ and y′ − z′ distributions of the SMC Cepheids are shown in the left lower, left upper, and right upper panels, respectively. In all the panels, the black points are the sample on the fitted plane and the red points are the outliers.
Current usage metrics show cumulative count of Article Views (full-text article views including HTML views, PDF and ePub downloads, according to the available data) and Abstracts Views on Vision4Press platform.
Data correspond to usage on the plateform after 2015. The current usage metrics is available 48-96 hours after online publication and is updated daily on week days.
Initial download of the metrics may take a while.