Fig. 4
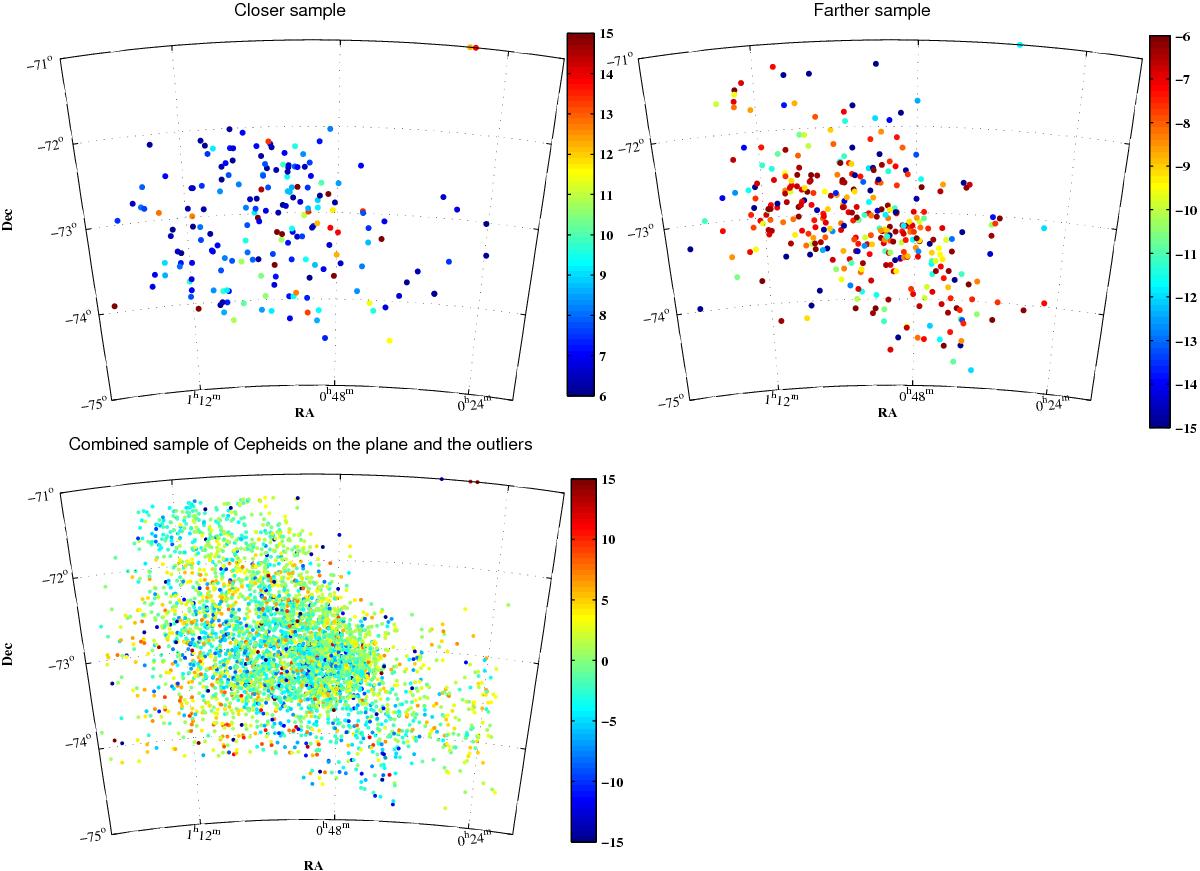
Two-dimensional plot of deviation. The colour bars in all the panels represent the values of the deviation in kpc from the best-fit plane to the SMC disk. The sample that shows absolute deviation larger than 6 kpc are considered as outliers from the plane, which implies that the sample with deviations in the range − 6 kpc to +6 kpc is on the plane. The closer sample is that which shows deviation larger than +6 kpc and the farther sample is that which shows deviation less than − 6 kpc.
Current usage metrics show cumulative count of Article Views (full-text article views including HTML views, PDF and ePub downloads, according to the available data) and Abstracts Views on Vision4Press platform.
Data correspond to usage on the plateform after 2015. The current usage metrics is available 48-96 hours after online publication and is updated daily on week days.
Initial download of the metrics may take a while.