Fig. 2
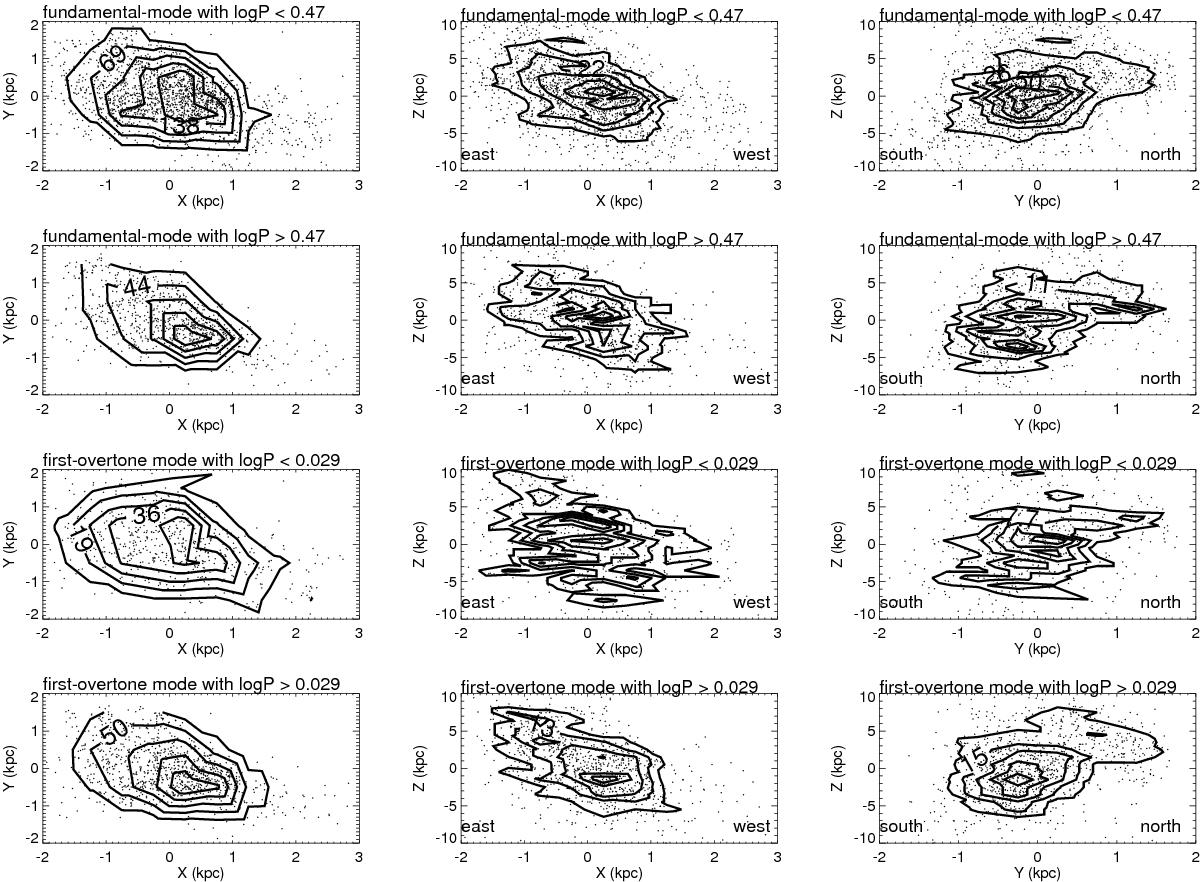
XY, XZ and YZ distributions of fundamental-mode and first-overtone Cepheids. The left panels show the XY distributions of different sub-samples. The middle panels show the XZ distributions of different sub-samples. The right panels show the YZ distributions of different sub-samples. The convention of z-axis is such that the +ve z-axis represents the direction towards the observer and the –ve z-axis represents the direction away from us. The density contours are overplotted in all the panels.
Current usage metrics show cumulative count of Article Views (full-text article views including HTML views, PDF and ePub downloads, according to the available data) and Abstracts Views on Vision4Press platform.
Data correspond to usage on the plateform after 2015. The current usage metrics is available 48-96 hours after online publication and is updated daily on week days.
Initial download of the metrics may take a while.