Fig. 3
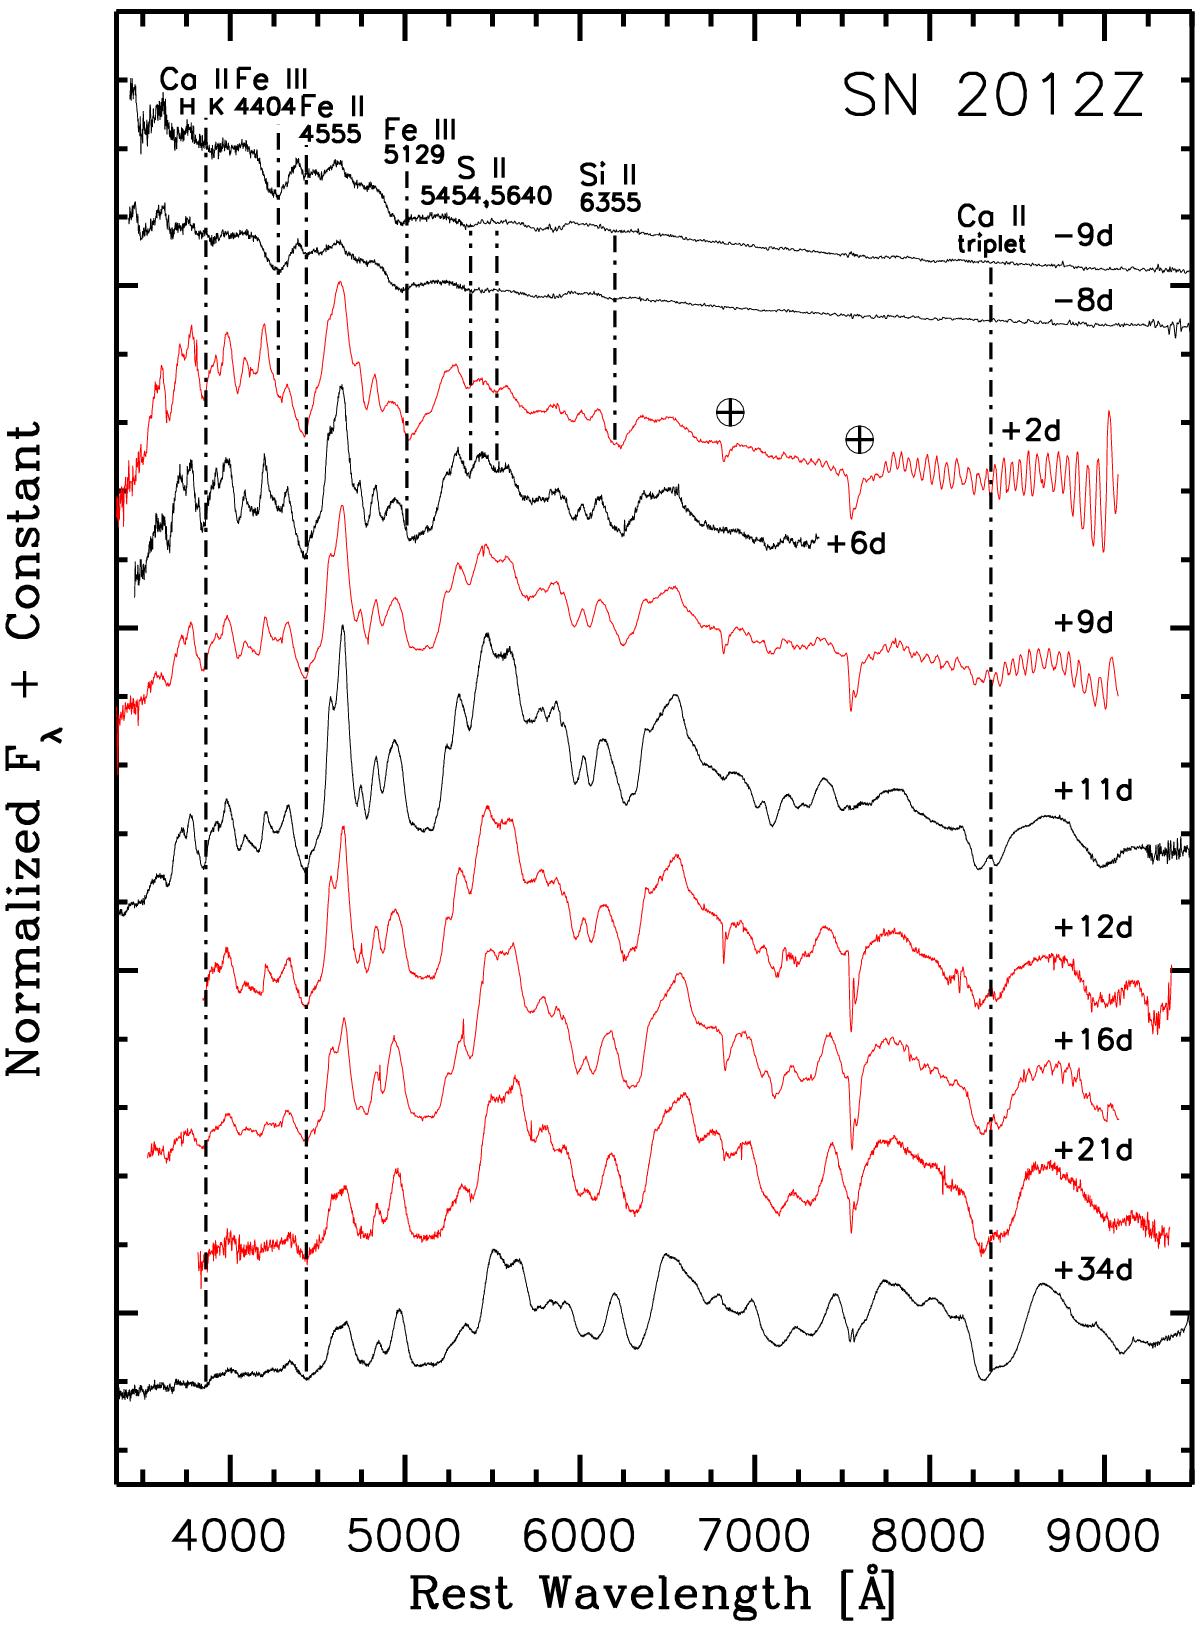
Early phase, visual-wavelength spectroscopy of SN 2012Z plotted in the rest frame of the host galaxy. A subset of spectra from Foley et al. (2013) are plotted in black, and our previously unpublished spectra are shown in red. Phase relative to T(B)max is listed to the right of each spectrum. Telluric features are indicated with an Earth symbol. The spectra obtained on +2d, +9d, and +16d suffer from moderate fringing.
Current usage metrics show cumulative count of Article Views (full-text article views including HTML views, PDF and ePub downloads, according to the available data) and Abstracts Views on Vision4Press platform.
Data correspond to usage on the plateform after 2015. The current usage metrics is available 48-96 hours after online publication and is updated daily on week days.
Initial download of the metrics may take a while.