Free Access
Fig. 7
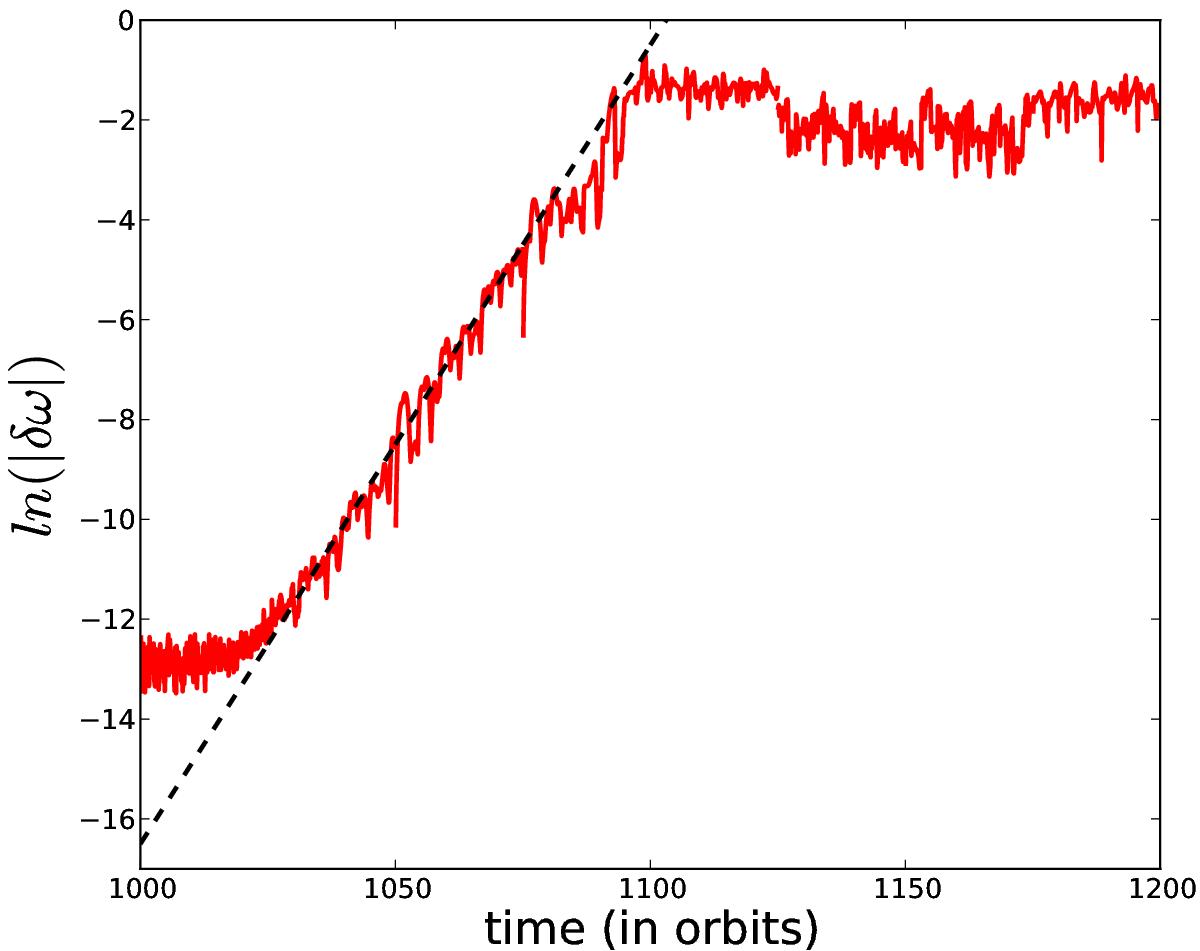
Evolution of the logarithm of the vorticity perturbation δω = ωmax(Rvort) − ωmin(Rvort) at the bump location in the 2D viscous simulation. The best fit of the linear part of the amplitude growth is plotted in black and has a slope equal to γ/ Ω(Rf) = 0.2.
Current usage metrics show cumulative count of Article Views (full-text article views including HTML views, PDF and ePub downloads, according to the available data) and Abstracts Views on Vision4Press platform.
Data correspond to usage on the plateform after 2015. The current usage metrics is available 48-96 hours after online publication and is updated daily on week days.
Initial download of the metrics may take a while.