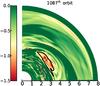
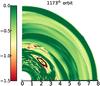
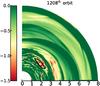
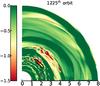
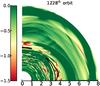
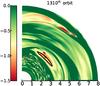
Fig. 2
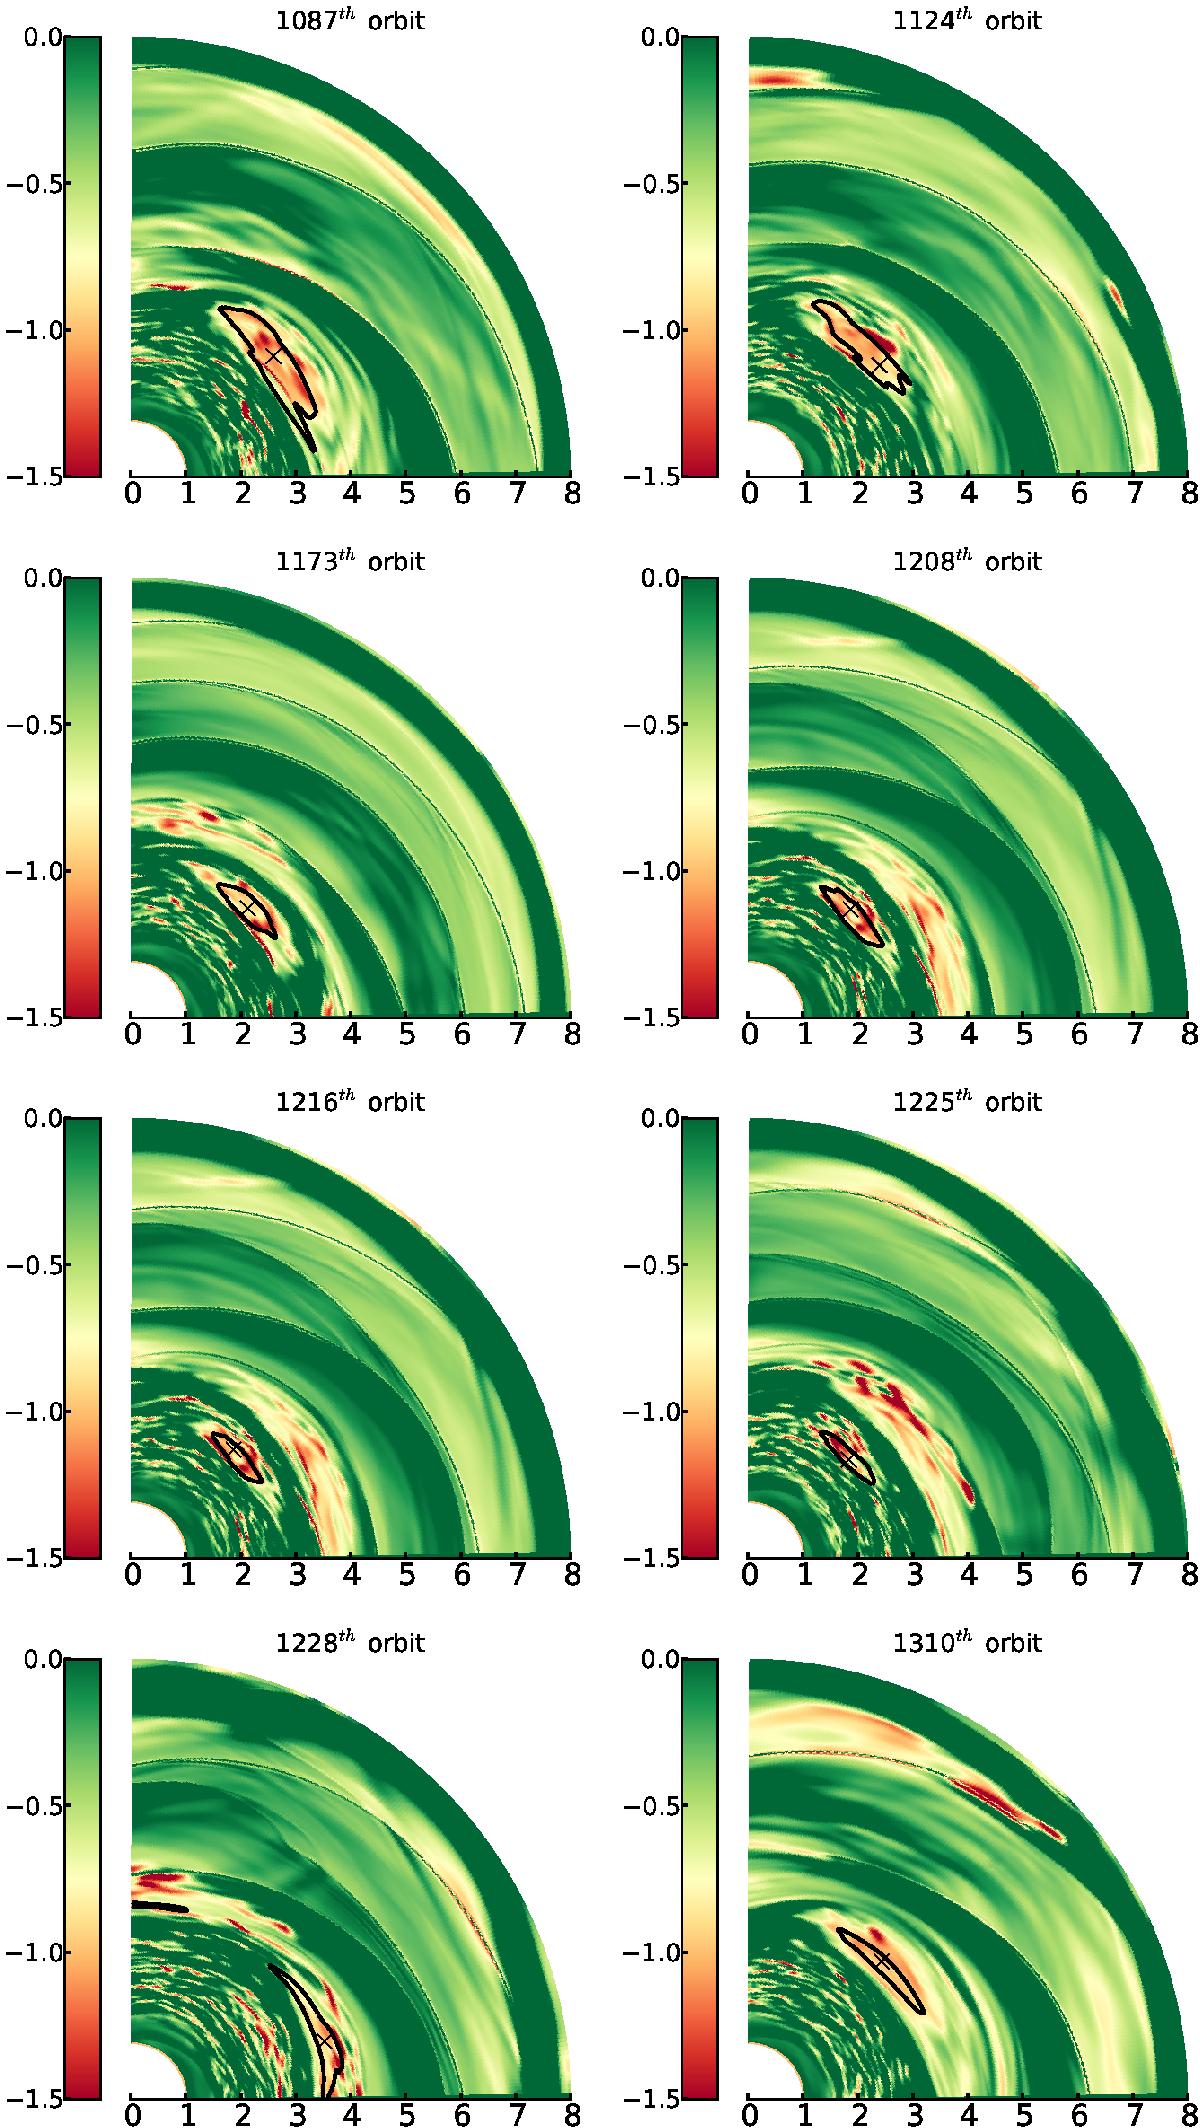
From left to right and top to bottom: snapshot of the relative vorticity perturbation at the 1087th, 1124th, 1173th, 1208th, 1216th, 1225th, 1228th, and 1310th orbit. The relative vorticity perturbation has been vertically averaged. We draw with a black line the iso-contour corresponding to 80% of the density maximum ρm. The location of the density maximum is shown by the black cross.


Current usage metrics show cumulative count of Article Views (full-text article views including HTML views, PDF and ePub downloads, according to the available data) and Abstracts Views on Vision4Press platform.
Data correspond to usage on the plateform after 2015. The current usage metrics is available 48-96 hours after online publication and is updated daily on week days.
Initial download of the metrics may take a while.