Fig. 13
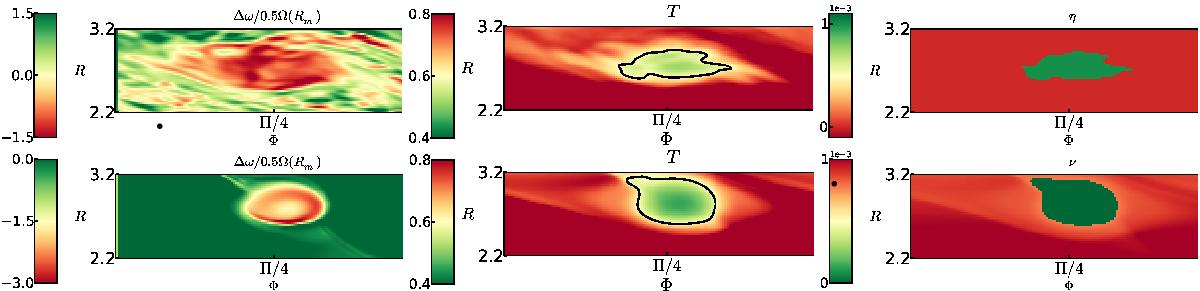
Top panels, from left to right: snapshots of the relative vorticity perturbation, the temperature and the resistivity in the vicinity of the vortex at the 1208th orbit, in the 3D simulation. The fields mapped on top panels have been vertically averaged. Bottom panels, from left to right: snapshots of the relative vorticity perturbation, the temperature and the viscosity in the vicinity of the vortex at the 2597th orbit, in the 2D simulation. We draw with a black line the iso-contour of temperature T = TMRI.
Current usage metrics show cumulative count of Article Views (full-text article views including HTML views, PDF and ePub downloads, according to the available data) and Abstracts Views on Vision4Press platform.
Data correspond to usage on the plateform after 2015. The current usage metrics is available 48-96 hours after online publication and is updated daily on week days.
Initial download of the metrics may take a while.