Fig. 8
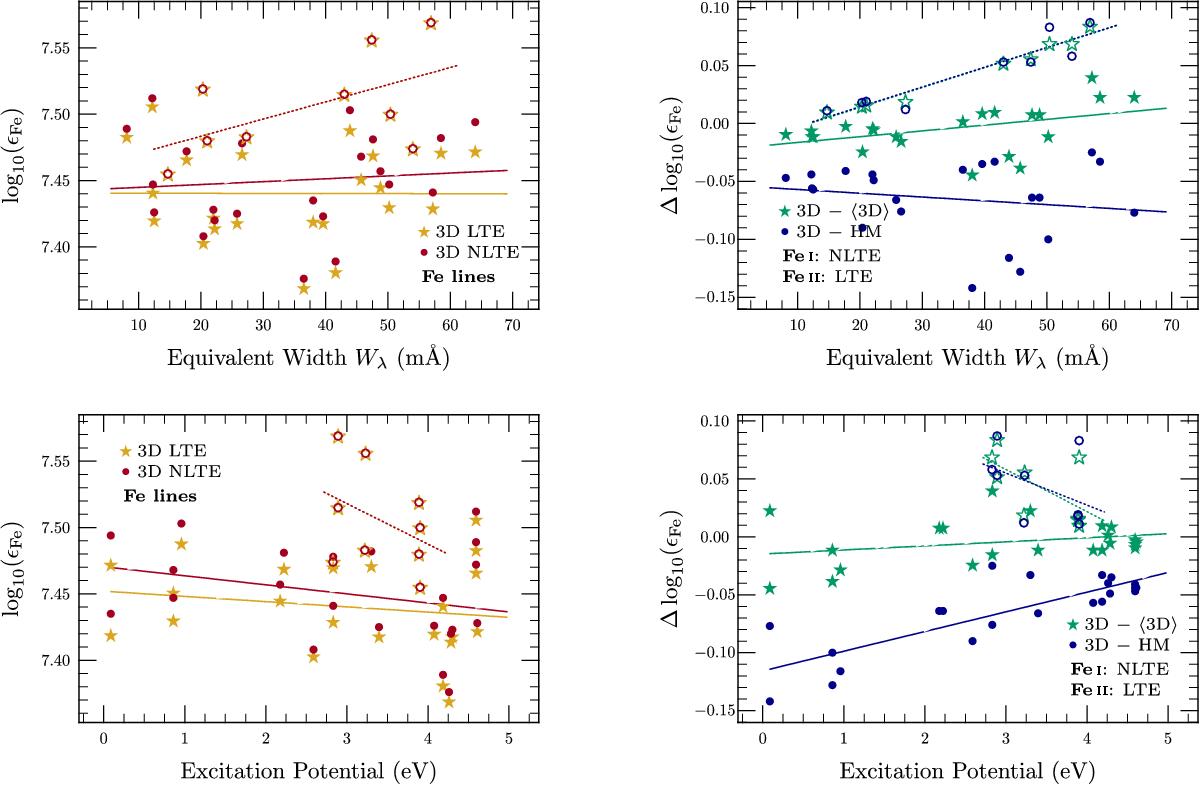
Left: 3D Fe abundances from Fe i and Fe ii lines, as a function of equivalent width and lower excitation potential. Right: line-by-line differences between abundances obtained with the 3D and ⟨ 3D ⟩ models, and between those obtained with the 3D and HM models. Filled symbols and solid trendlines indicate neutral lines, open symbols and dotted lines indicate singly-ionised lines.
Current usage metrics show cumulative count of Article Views (full-text article views including HTML views, PDF and ePub downloads, according to the available data) and Abstracts Views on Vision4Press platform.
Data correspond to usage on the plateform after 2015. The current usage metrics is available 48-96 hours after online publication and is updated daily on week days.
Initial download of the metrics may take a while.