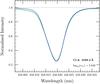
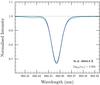
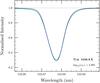
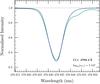
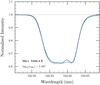
Fig. 1
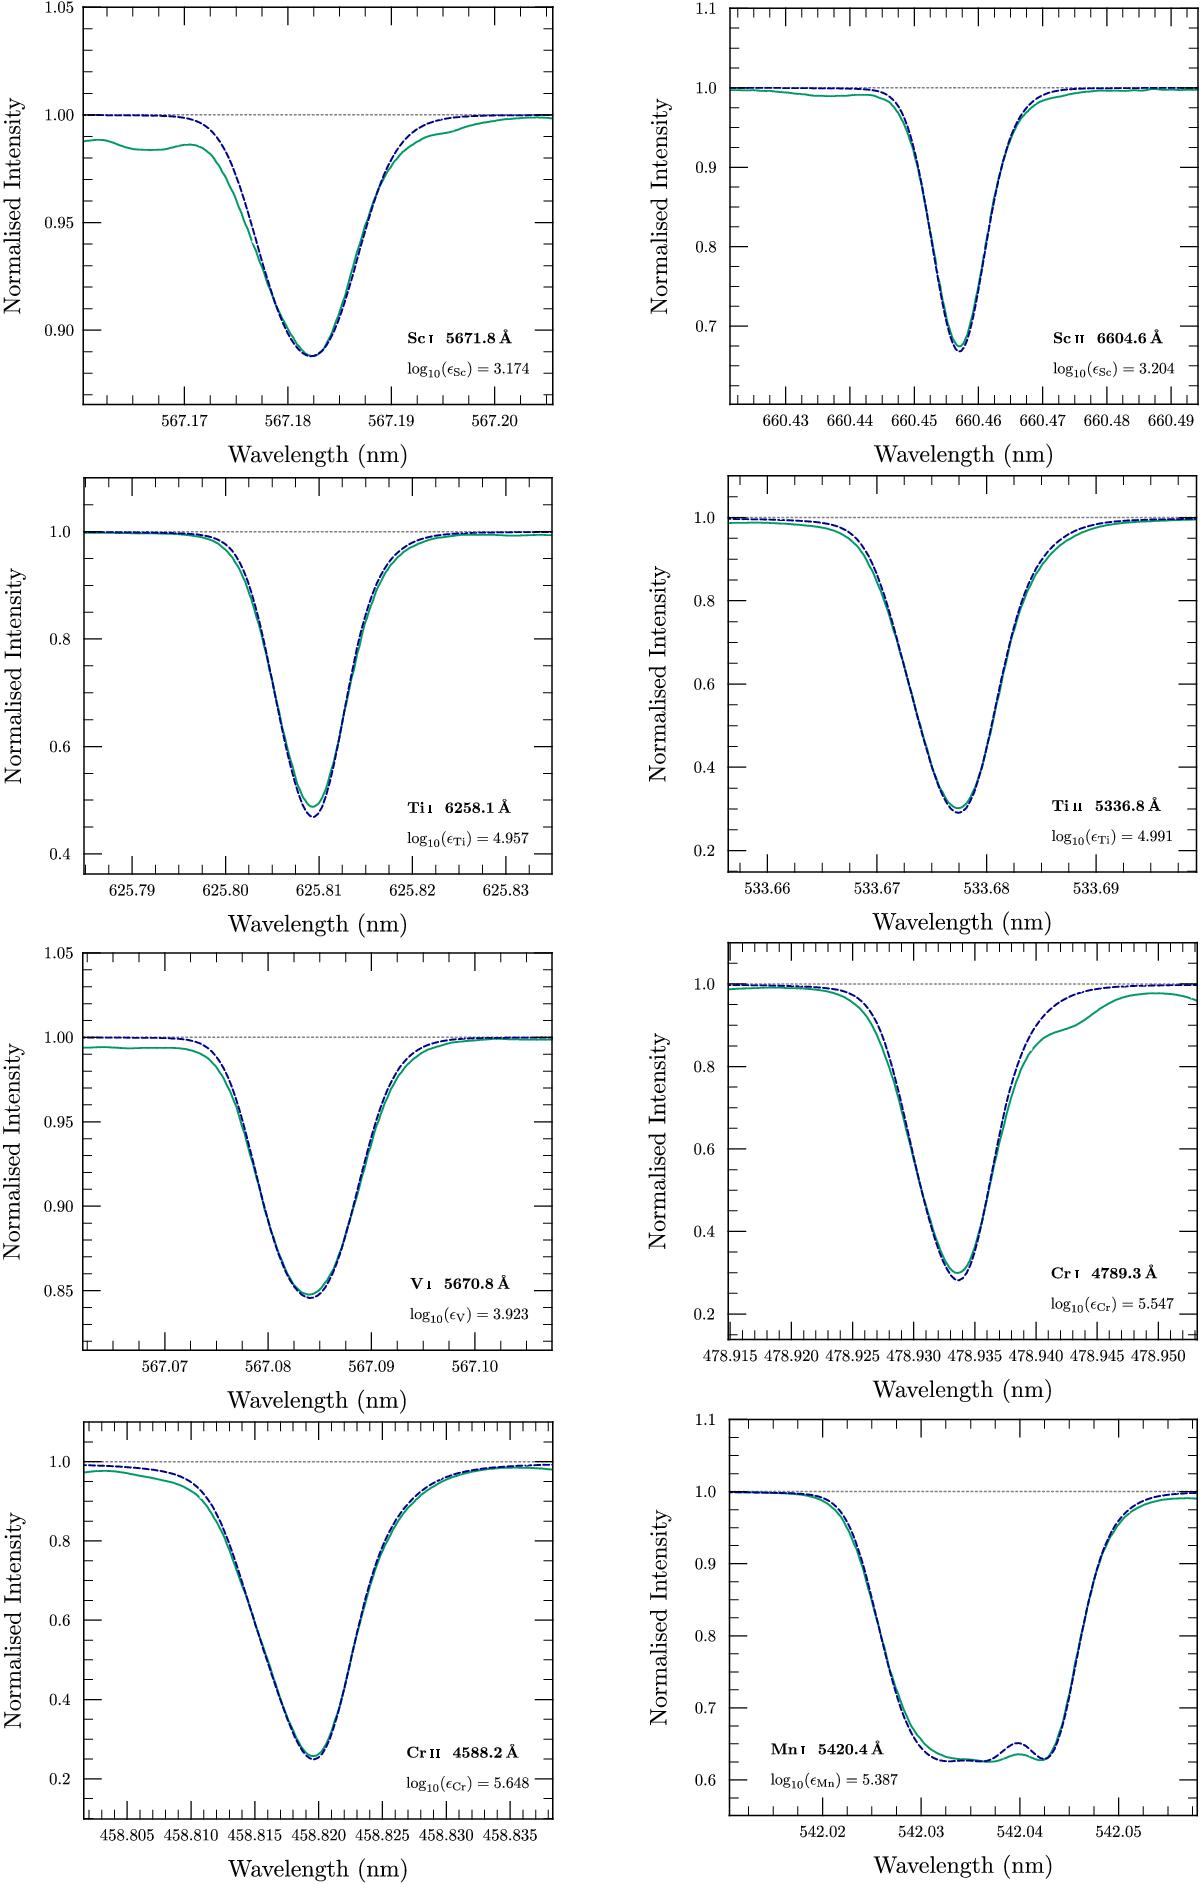
Example spatially and temporally averaged, disc-centre synthesised Sc i, Sc ii, Ti i, Ti ii, V i, Cr i, Cr ii and Mn i line profiles (blue dashed), shown in comparison to the observed FTS profile (solid green). We removed the solar gravitational redshift from the FTS spectrum, convolved the synthesised profile with an instrumental sinc function and fitted it in abundance. Wavelengths and continuum placements have been adjusted for display purposes. Plotted profiles are computed in LTE, but quoted abundances in each panel include NLTE corrections computed in 1D (wherever available).
Current usage metrics show cumulative count of Article Views (full-text article views including HTML views, PDF and ePub downloads, according to the available data) and Abstracts Views on Vision4Press platform.
Data correspond to usage on the plateform after 2015. The current usage metrics is available 48-96 hours after online publication and is updated daily on week days.
Initial download of the metrics may take a while.