Fig. 4
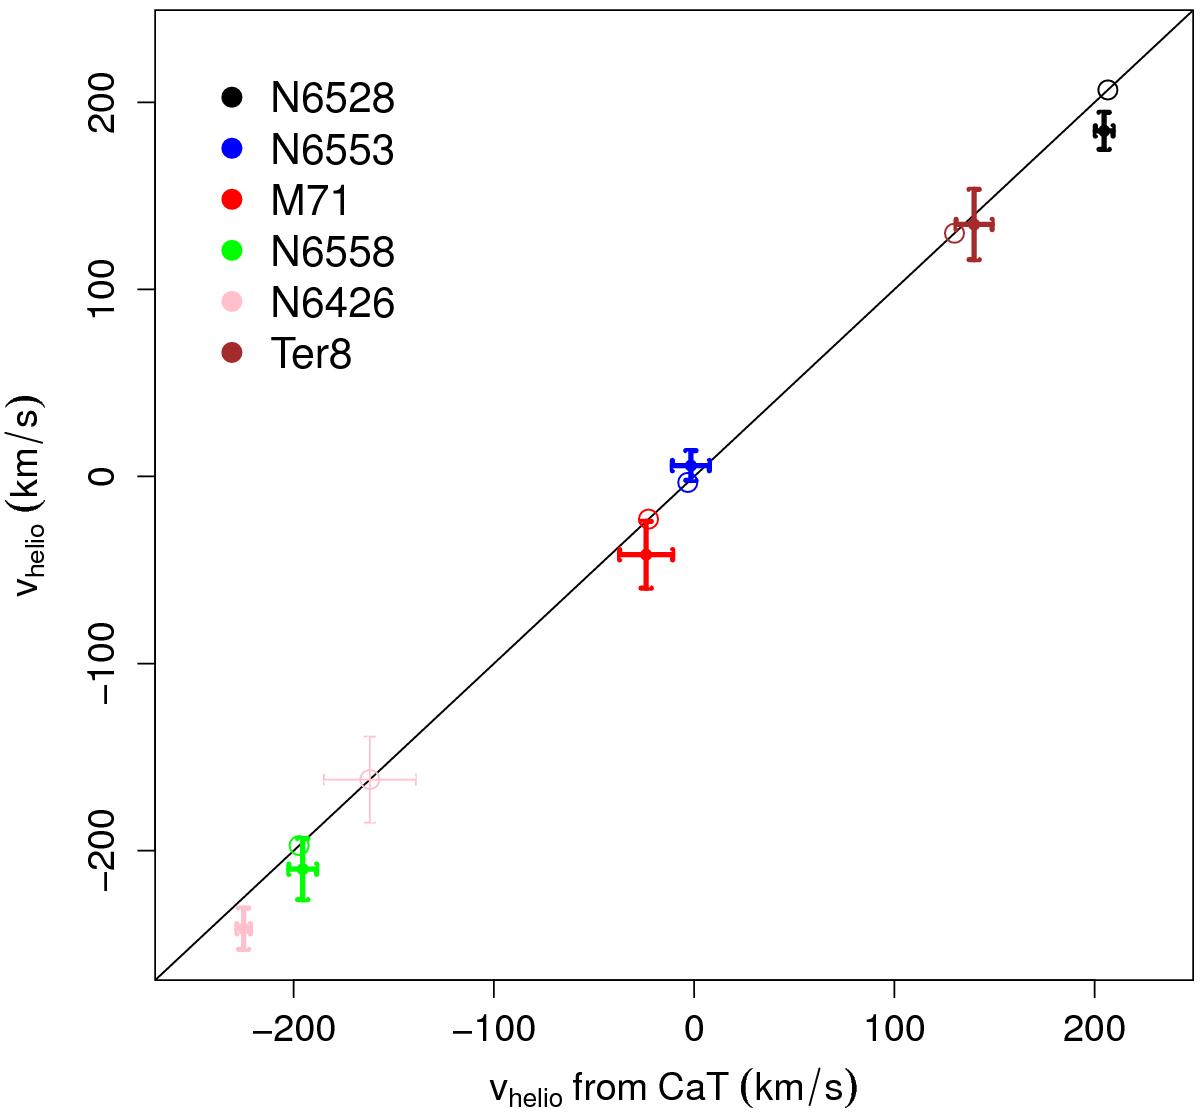
Average of heliocentric radial velocities of member stars (see details in Sect. 4.3 and values in Table 3) for each globular cluster. Our results are plotted against those from CaT spectroscopy (Saviane et al. 2012) and Vasquez et al. (in prep.) which match well. The error bars are the standard deviation of the average. A one-to-one line is plotted to guide the eye, while radial velocities from Harris (1996, 2010 edition) are overplotted as empty circles.
Current usage metrics show cumulative count of Article Views (full-text article views including HTML views, PDF and ePub downloads, according to the available data) and Abstracts Views on Vision4Press platform.
Data correspond to usage on the plateform after 2015. The current usage metrics is available 48-96 hours after online publication and is updated daily on week days.
Initial download of the metrics may take a while.