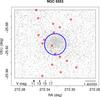
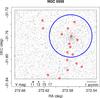
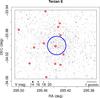
Fig. 2
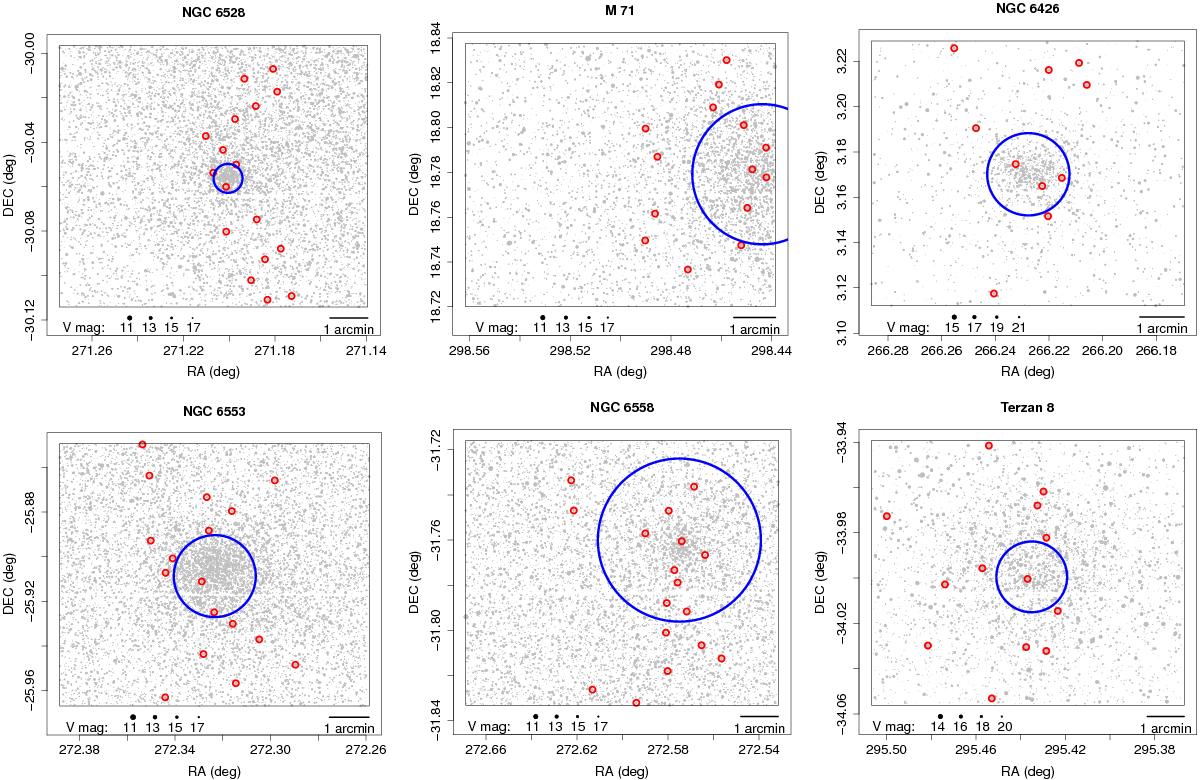
Sky map of all clusters. The panels show the same as in Fig. 1. Only the brightest stars are shown, and the size of the dots scales with the star magnitudes, as indicated in each plot. Selected RGB stars for spectroscopic observations are plotted in red. The blue circle corresponds to the half-light radius of each cluster from Table 2.
Current usage metrics show cumulative count of Article Views (full-text article views including HTML views, PDF and ePub downloads, according to the available data) and Abstracts Views on Vision4Press platform.
Data correspond to usage on the plateform after 2015. The current usage metrics is available 48-96 hours after online publication and is updated daily on week days.
Initial download of the metrics may take a while.