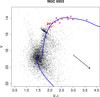
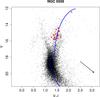
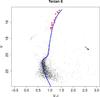
Fig. 1
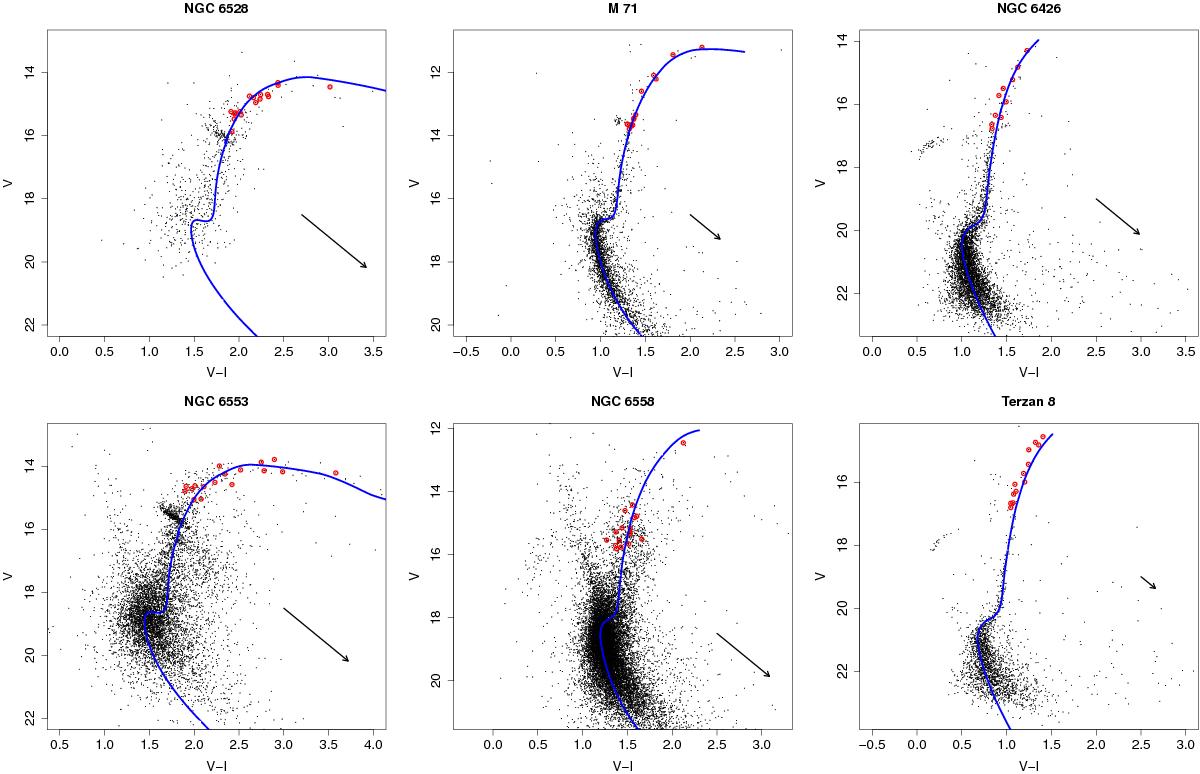
Colour−magnitude diagrams of all clusters. The left panels show metal-rich clusters, middle panels are intermediate-metallicity clusters, and right panels correspond to the more metal-poor ones. All stars within 2 × rhalf−light are plotted, without any cleaning procedure. Dartmouth isochrones with literature parameters (Table 2) are overplotted. Selected RGB stars for spectroscopic observations are plotted in red. Reddening vectors are shown in each CMD based on E(B − V) listed in Table 2.
Current usage metrics show cumulative count of Article Views (full-text article views including HTML views, PDF and ePub downloads, according to the available data) and Abstracts Views on Vision4Press platform.
Data correspond to usage on the plateform after 2015. The current usage metrics is available 48-96 hours after online publication and is updated daily on week days.
Initial download of the metrics may take a while.