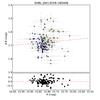
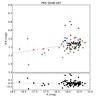
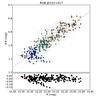
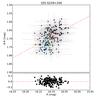
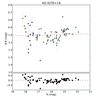
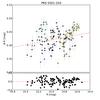
Fig. 1

B − R color vs. R-band magnitude diagrams for SHBL J001355.9–18540, PKS 0048-097, RGB J0152+017, 1ES 0229+200, AO 0235+16, and PKS 0301–243. At each panel red dashed lines denote the fitted CM linear correlations (see Table 1). Color of a given data point indicates the time of a given measurement. The earliest pointings are denoted by dark blue symbols and the most recent ones depicted in red, with the rainbow color scale normalized to the entire span of the ATOM observations of a given blazar.
Current usage metrics show cumulative count of Article Views (full-text article views including HTML views, PDF and ePub downloads, according to the available data) and Abstracts Views on Vision4Press platform.
Data correspond to usage on the plateform after 2015. The current usage metrics is available 48-96 hours after online publication and is updated daily on week days.
Initial download of the metrics may take a while.