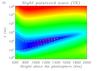
Fig. 3
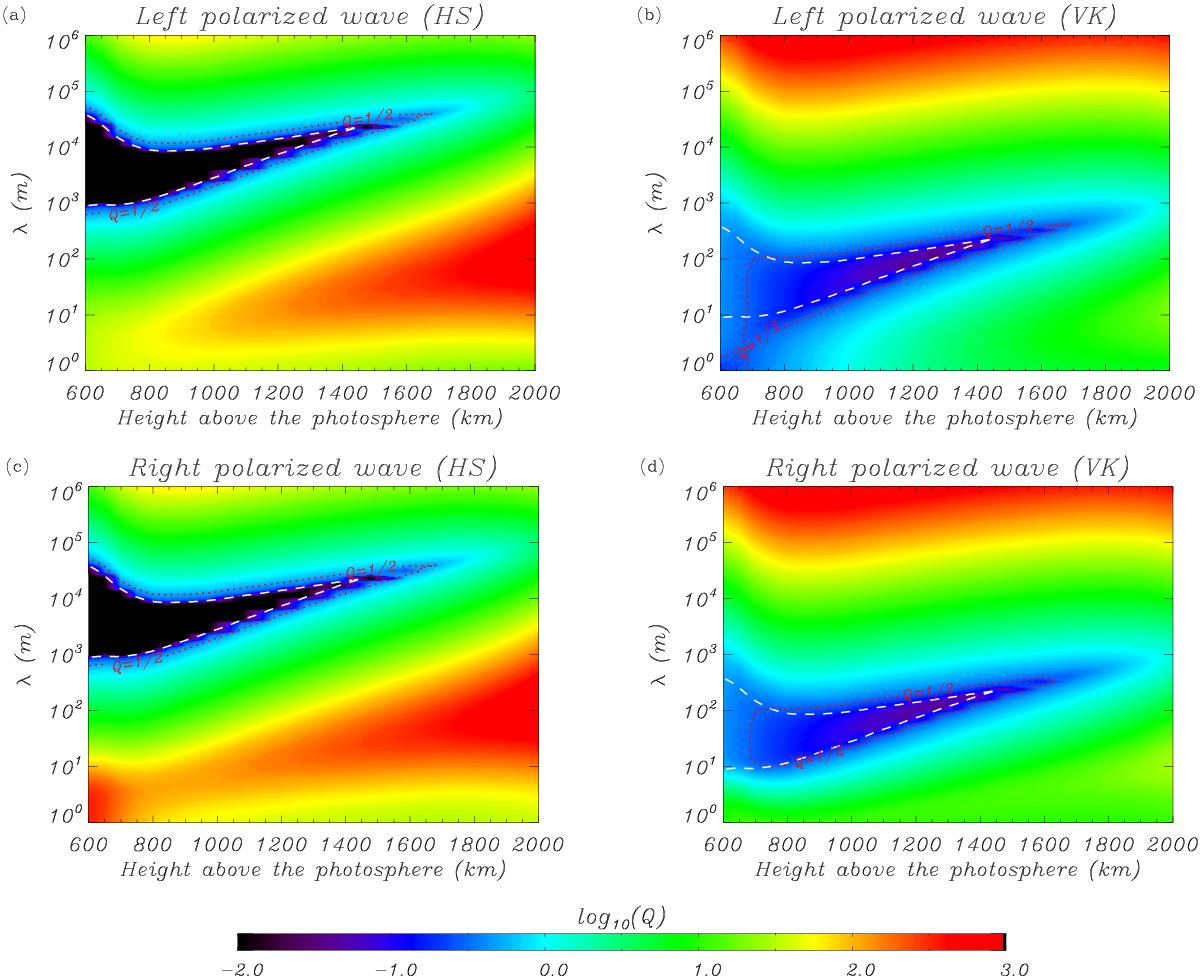
Contour plots of the quality factor Q (in logarithmic scale) of impulsively driven Alfvén waves in the upper solar chromosphere as function of the wavelength λ (vertical axis in logarithmic scale) and height above the photosphere (horizontal axis). Top and botton panels correspond to the left and right polarized waves, respectively. Left and right panels are the results obtained using the hard-sphere cross sections (HS) and the Vranjes & Krstic (2013) cross sections (VK), respectively. The red dotted lines enclose zones where Alfvén waves are overdamped, i.e., Q< 1/2. The white dashed lines correspond to the approximate critical wavelengths given in Eqs. (39) and (40). We note that the VK results are only strictly valid for heights larger than 900 km.
Current usage metrics show cumulative count of Article Views (full-text article views including HTML views, PDF and ePub downloads, according to the available data) and Abstracts Views on Vision4Press platform.
Data correspond to usage on the plateform after 2015. The current usage metrics is available 48-96 hours after online publication and is updated daily on week days.
Initial download of the metrics may take a while.