Free Access
Fig. 9
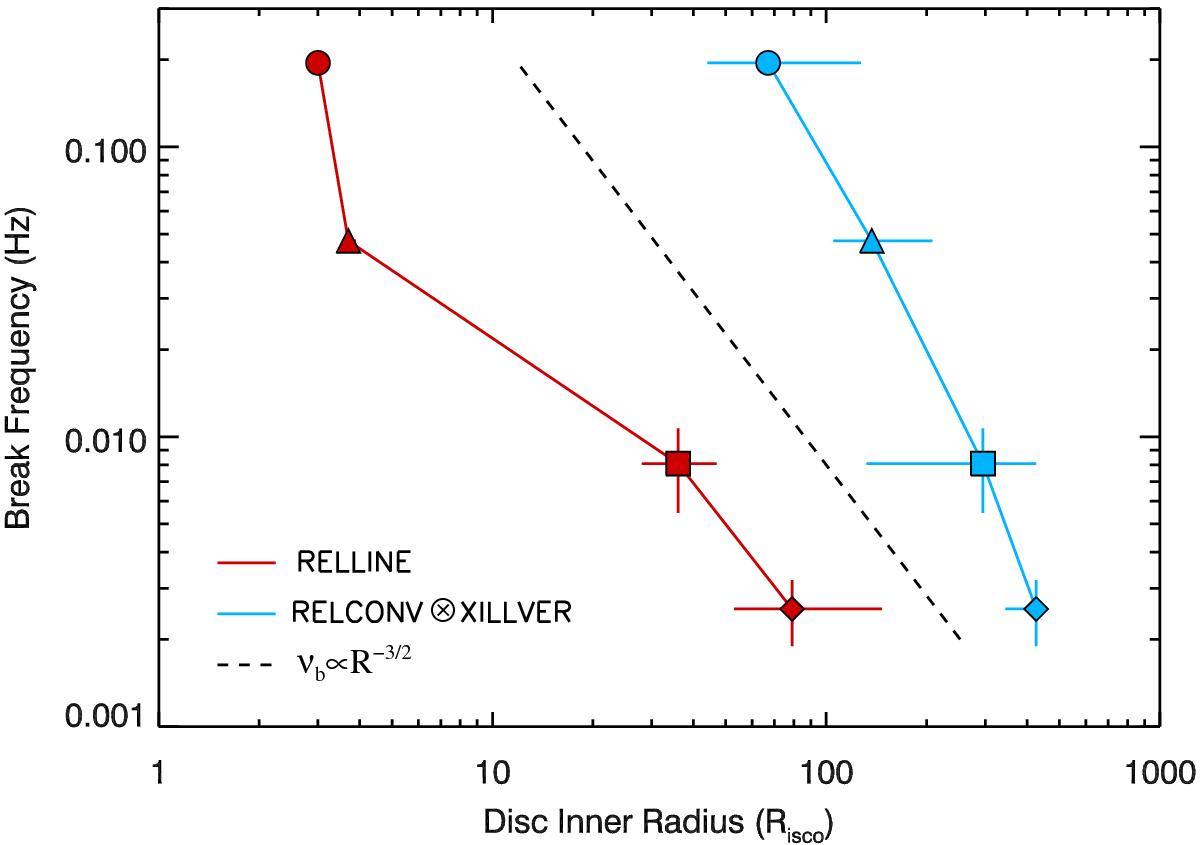
Estimated disc inner radii (x-axis; Table 3) using relline (red) and relconv∗xillver (green) versus and the fitted break frequency from simultaneous RXTE observations (y-axis; Table 5). The dotted line represents the relation ν ∝ R− 3 / 2, which corresponds to the dynamical and viscous timescales for accretion onto a BH.
Current usage metrics show cumulative count of Article Views (full-text article views including HTML views, PDF and ePub downloads, according to the available data) and Abstracts Views on Vision4Press platform.
Data correspond to usage on the plateform after 2015. The current usage metrics is available 48-96 hours after online publication and is updated daily on week days.
Initial download of the metrics may take a while.