Fig. 6
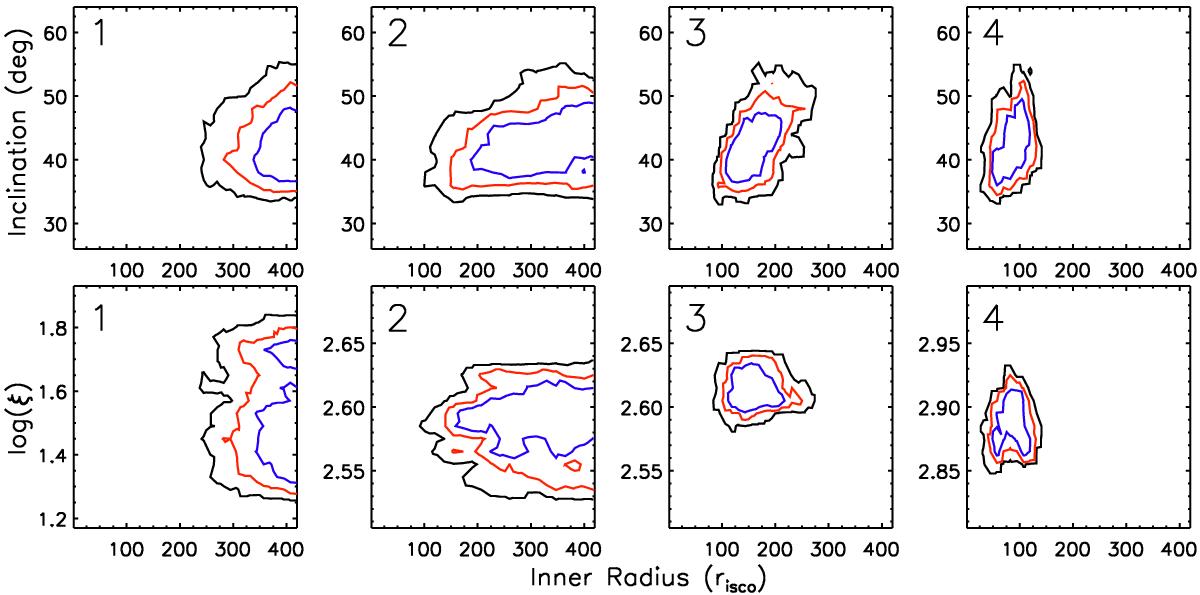
Two-dimensional probability distributions of the inclination (top) and ionisation (bottom) parameters with the inner radius. For each panel we plot contour levels at the 68% (blue), 90% (red) and 99% (black) confidence levels. Each plot contains the full distribution for the whole parameter range with the axis reduced for clarity. In all eight distributions there is no indication of a significant correlation between the parameters.
Current usage metrics show cumulative count of Article Views (full-text article views including HTML views, PDF and ePub downloads, according to the available data) and Abstracts Views on Vision4Press platform.
Data correspond to usage on the plateform after 2015. The current usage metrics is available 48-96 hours after online publication and is updated daily on week days.
Initial download of the metrics may take a while.