Fig. 5
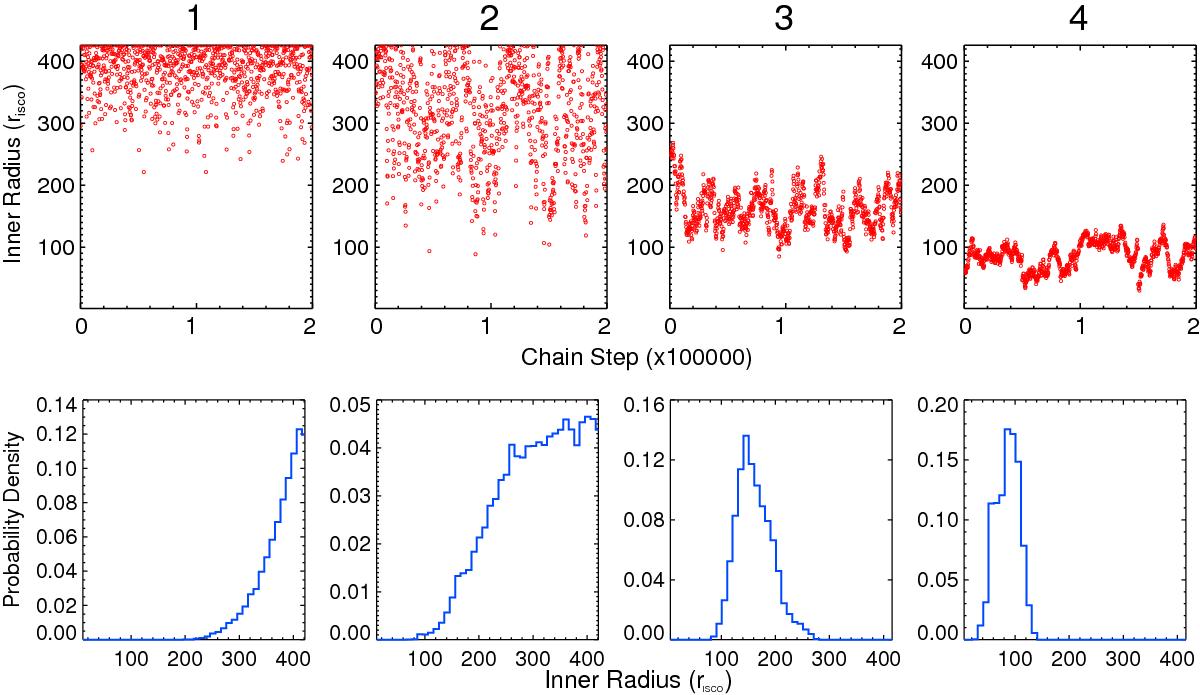
Inner radius results from our MCMC based analysis displayed from left to right for Observations 1 to 4 respectively. Top panels: the distribution of inner radius values along the 200 000 element chain with every 200th element displayed for clarity. Lower panels: probability distributions for the inner radius, each bin has a width of 10 risco. An inner accretion disc at the ISCO is clearly ruled out for the four hard state observations.
Current usage metrics show cumulative count of Article Views (full-text article views including HTML views, PDF and ePub downloads, according to the available data) and Abstracts Views on Vision4Press platform.
Data correspond to usage on the plateform after 2015. The current usage metrics is available 48-96 hours after online publication and is updated daily on week days.
Initial download of the metrics may take a while.