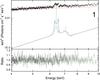
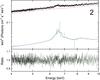
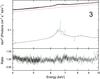
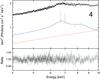
Fig. 4
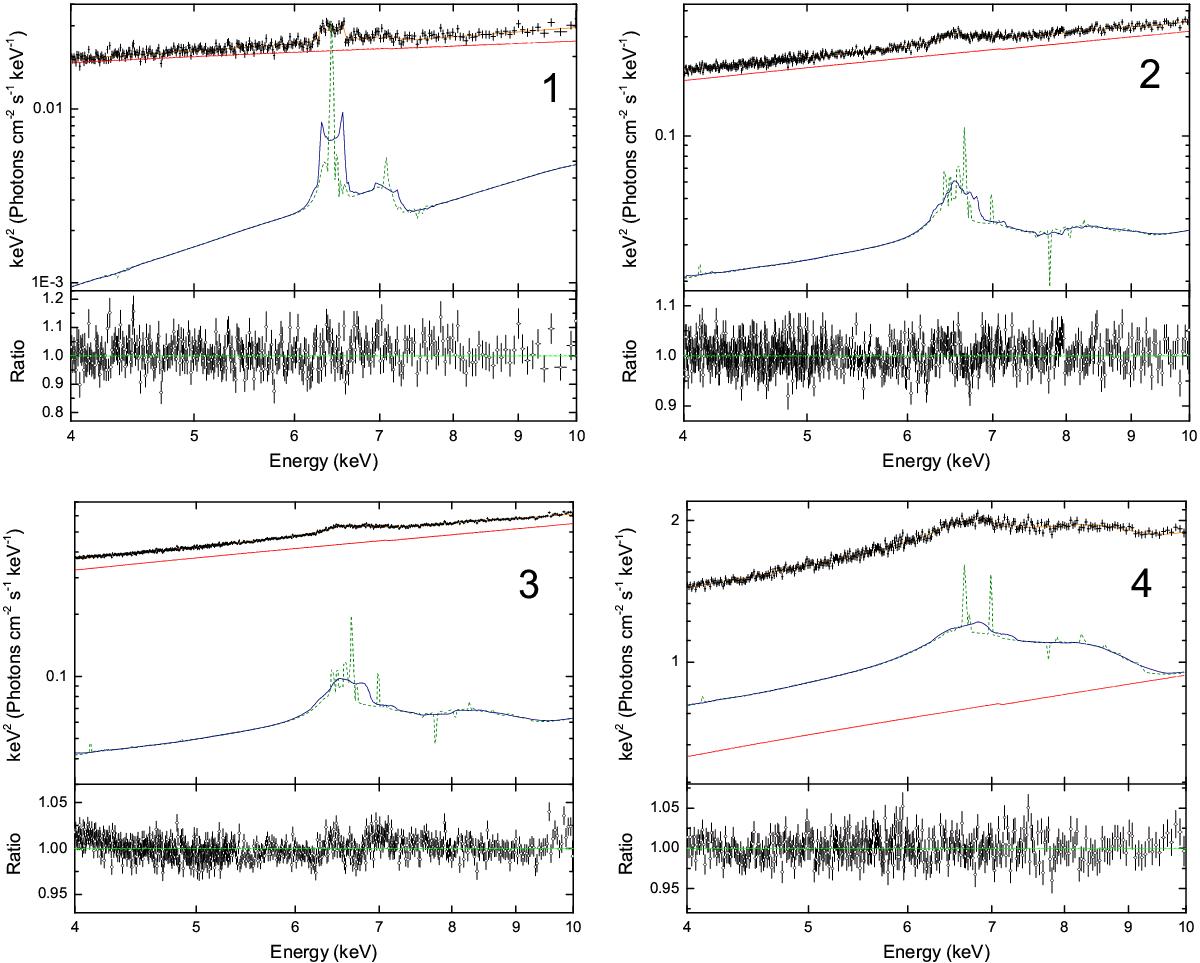
Unfolded spectral fit and data/model ratios of the simultaneous fitting of the four hard state observations in Table 1, using the blurred reflection model relconv∗xillver. The up-scattered disc emission is indicated by the red lines and the composite model is overlaid in orange. We present the reflection in two ways: the blue solid lines show the blurred reflection as fitted, whilst the green dashed lines display the reflection spectrum when the relativistic blurring (relconv) is removed. Please note that the green dashed lines are not part of the fit, they are purely to allow the evolution of the profile due to ionisation and relativistic effects to be viewed separately. All of the spectra have been re-binned for the purposes of plotting.
Current usage metrics show cumulative count of Article Views (full-text article views including HTML views, PDF and ePub downloads, according to the available data) and Abstracts Views on Vision4Press platform.
Data correspond to usage on the plateform after 2015. The current usage metrics is available 48-96 hours after online publication and is updated daily on week days.
Initial download of the metrics may take a while.