Fig. 2
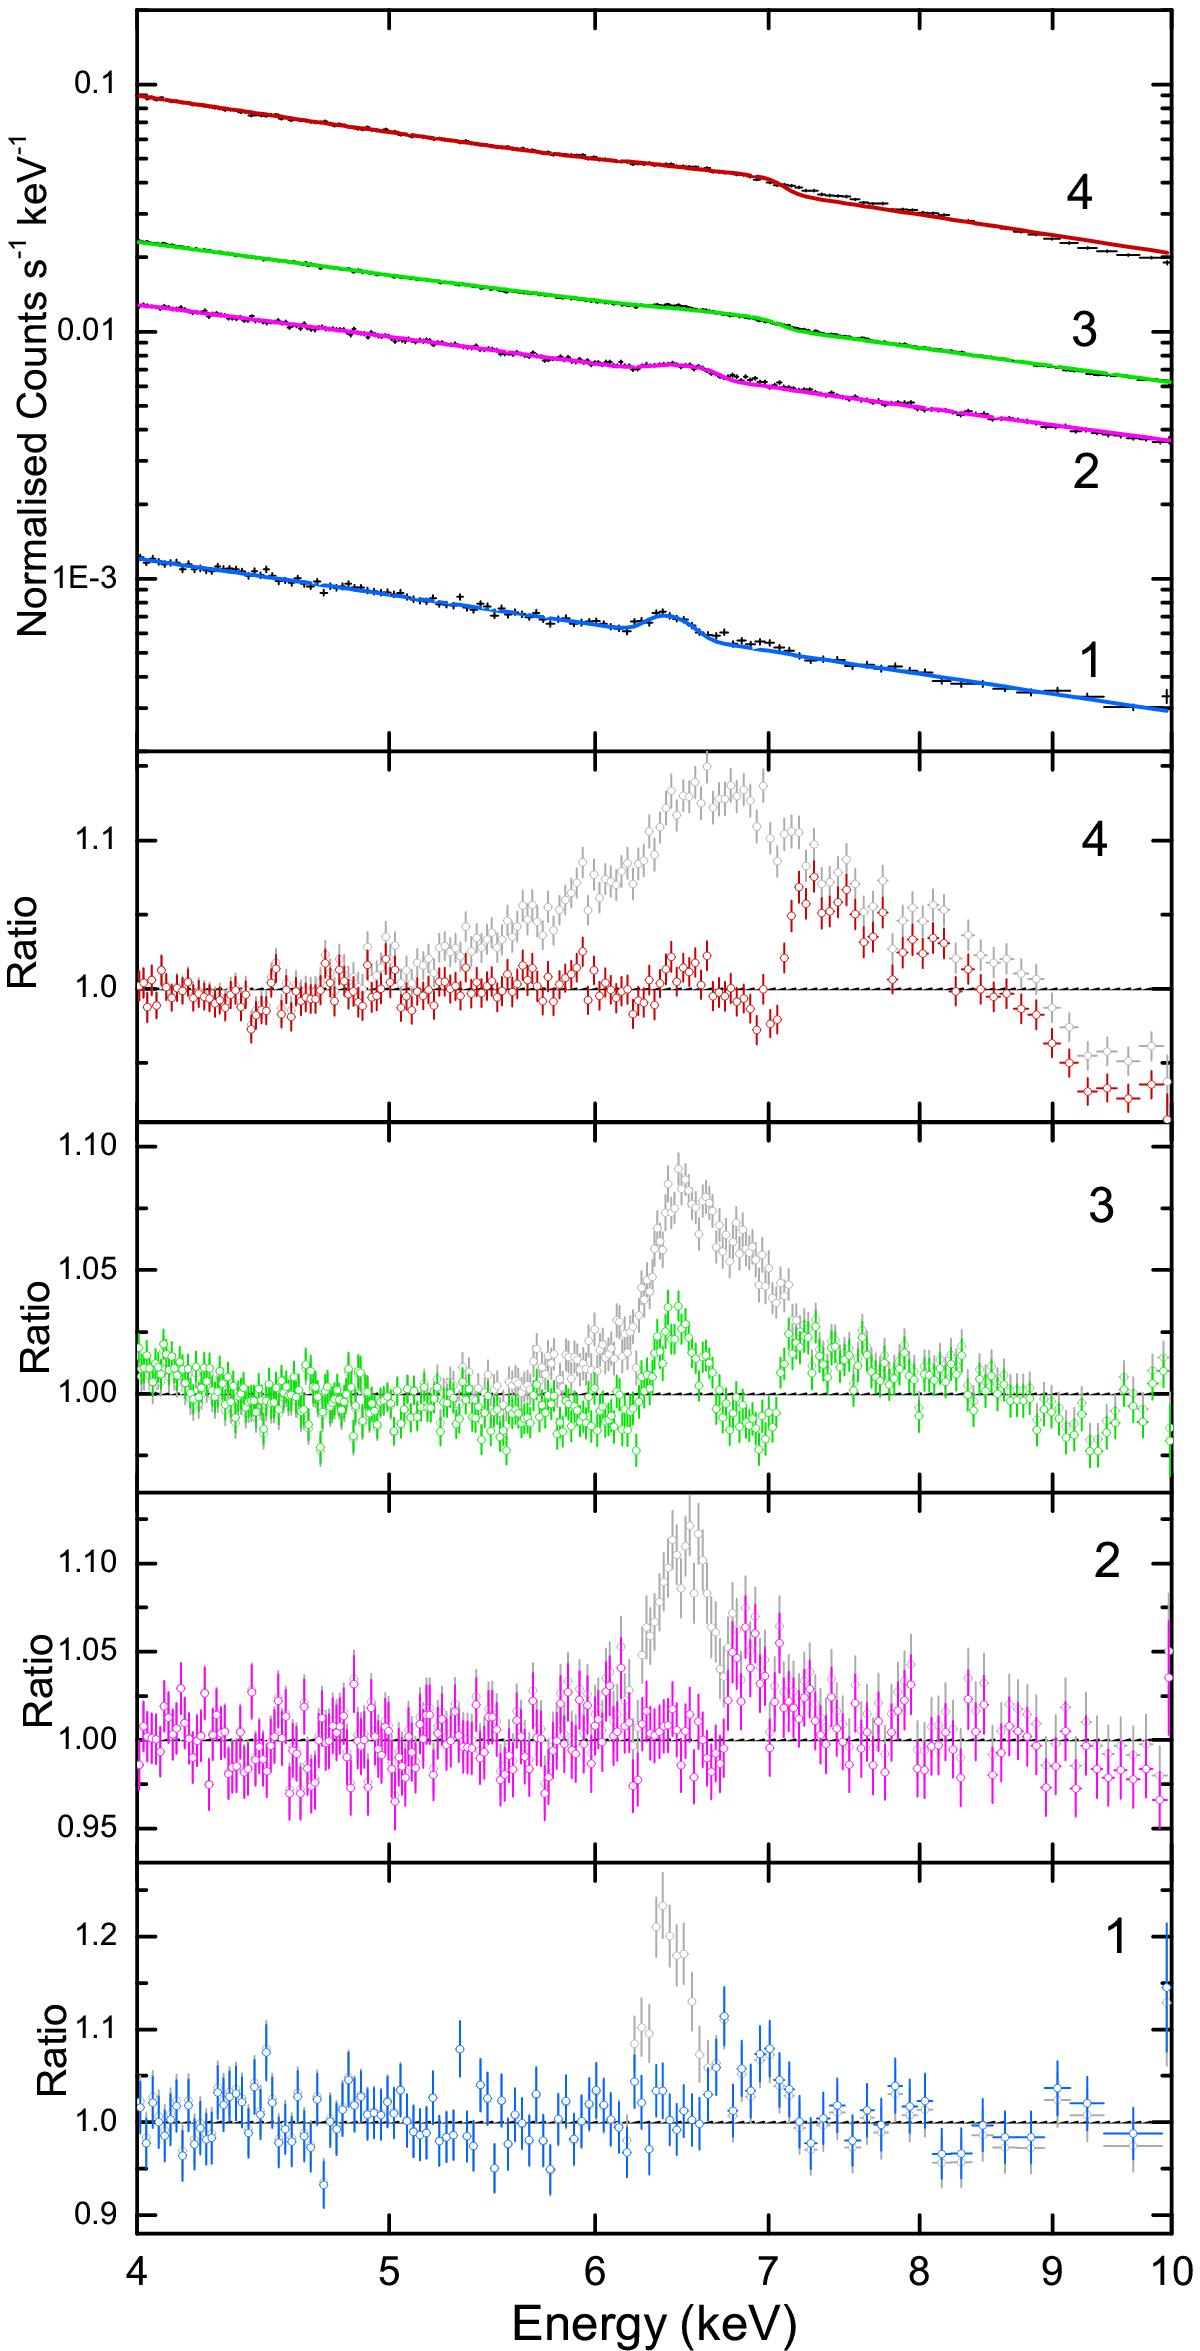
Our four hard state datasets simultaneously modelled using relline for the Fe Kα emission line. The top panel shows the resultant best fit with the remaining panels displaying the model residuals for each observation using the same colour scheme as in Fig. 1. Additionally the model residuals from Fig. 1 are overlaid in grey. These correspond to the absorbed power-law continuum (phabs∗powerlaw) before the Fe line is fitted, as described in Sect. 3.2. This therefore indicates how the relline model is fitting the overall shape of the Fe band. All of the spectra have been re-binned for the purposes of plotting. Note as well that the line profile of Observation 4 is slightly different to Figure 1, which included the smedge model.
Current usage metrics show cumulative count of Article Views (full-text article views including HTML views, PDF and ePub downloads, according to the available data) and Abstracts Views on Vision4Press platform.
Data correspond to usage on the plateform after 2015. The current usage metrics is available 48-96 hours after online publication and is updated daily on week days.
Initial download of the metrics may take a while.