Fig. 1
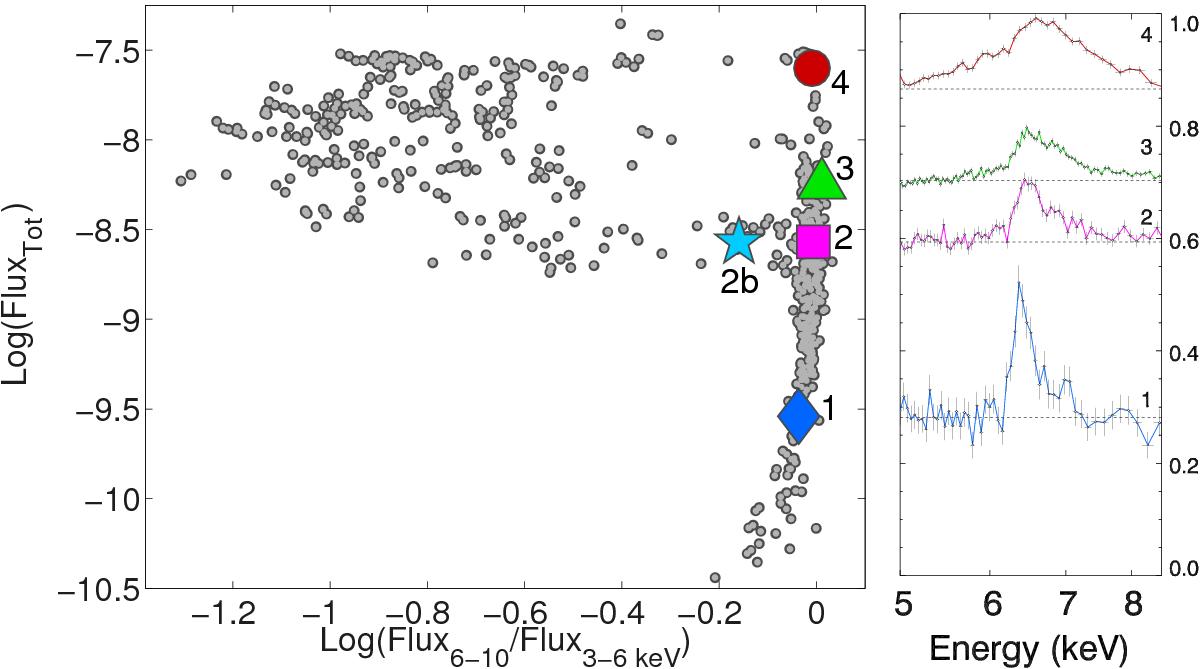
Left: a Hardness intensity diagram (HID) of all GX 339-4 outbursts monitored by RXTE (1995-2011; grey points). The large coloured symbols indicate the positions of our chosen observations described in Table 1: blue/diamond (1), magenta/square (2), green/triangle (3), red/circle (4), and cyan/star (2b). The flux has units of erg cm-2 s-1. Right: data/model ratio of continuum fits to the four hard state spectra when the “ignored” energy range (5−8 keV) in Table 1 are added (“noticed” in XSPEC) back in, indicating the shape and strength of the Fe line region between observations. Each spectra are shifted arbitrarily to match the left figure and follow the same ratio scale on the y-axis. The data have been re-binned for plotting purposes as well. The cyan HIMS observation (2b) is not shown. This is since it would overlap the Observation 3 ratio and is in a different spectral state to the others. The line profile of Observation 2b is instead displayed in Fig. 7.
Current usage metrics show cumulative count of Article Views (full-text article views including HTML views, PDF and ePub downloads, according to the available data) and Abstracts Views on Vision4Press platform.
Data correspond to usage on the plateform after 2015. The current usage metrics is available 48-96 hours after online publication and is updated daily on week days.
Initial download of the metrics may take a while.