Fig. 9
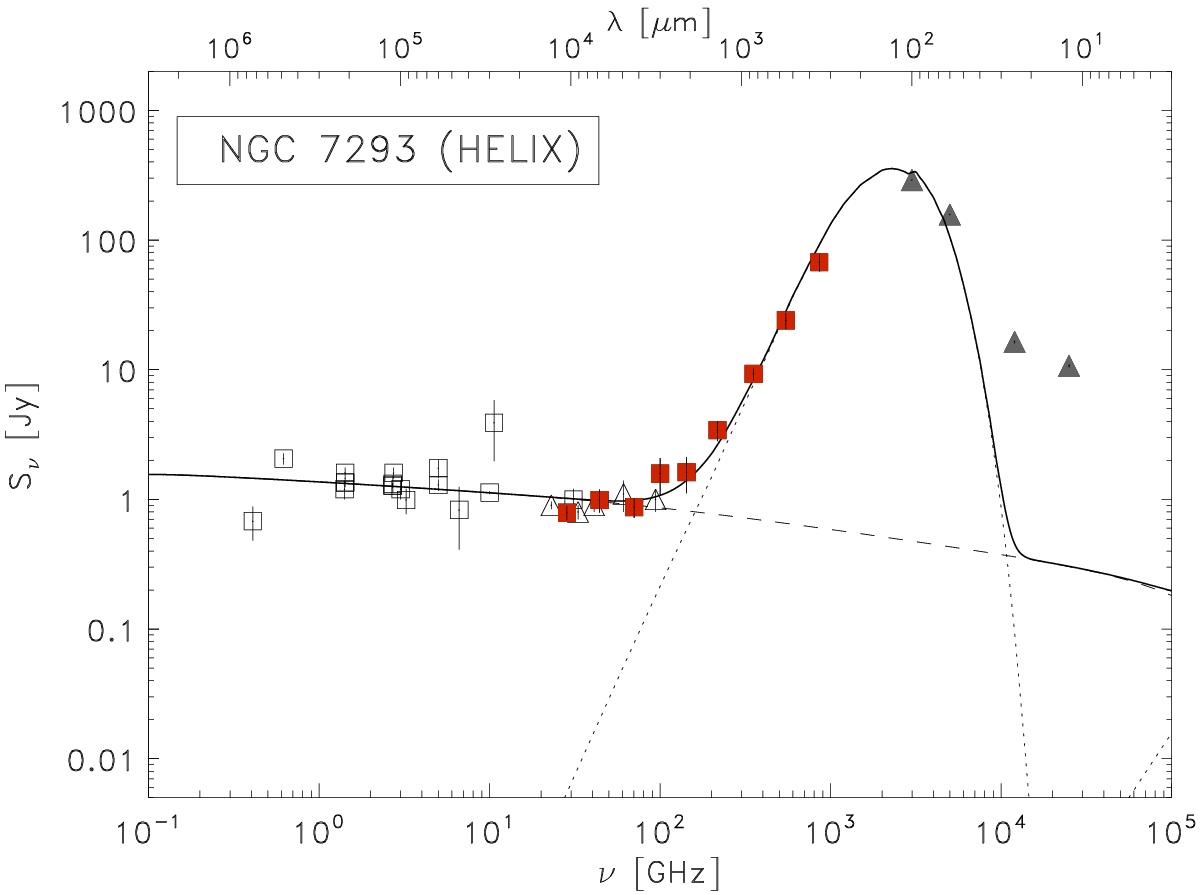
Model of the SED of NGC 7293 (continuous line) considering both free-free (dashed line) and thermal dust emission (dotted line). Ancillary radio measurements, obtained with different instruments, are shown as open squares (reference numbers given in Table 1: 2, 3, 6, 7, 16, 17, 18, 19, 23, 29 and 52), WMAP 7-year data as open triangles, aperture photometry from IRIS as filled triangles, and Planck data are shown as red squares. IRIS data at 12 m and 25 m, which are contaminated by emission lines, are also shown in the plot for completeness, but were not considered in the fitting procedure (see text).
Current usage metrics show cumulative count of Article Views (full-text article views including HTML views, PDF and ePub downloads, according to the available data) and Abstracts Views on Vision4Press platform.
Data correspond to usage on the plateform after 2015. The current usage metrics is available 48-96 hours after online publication and is updated daily on week days.
Initial download of the metrics may take a while.