Fig. 6
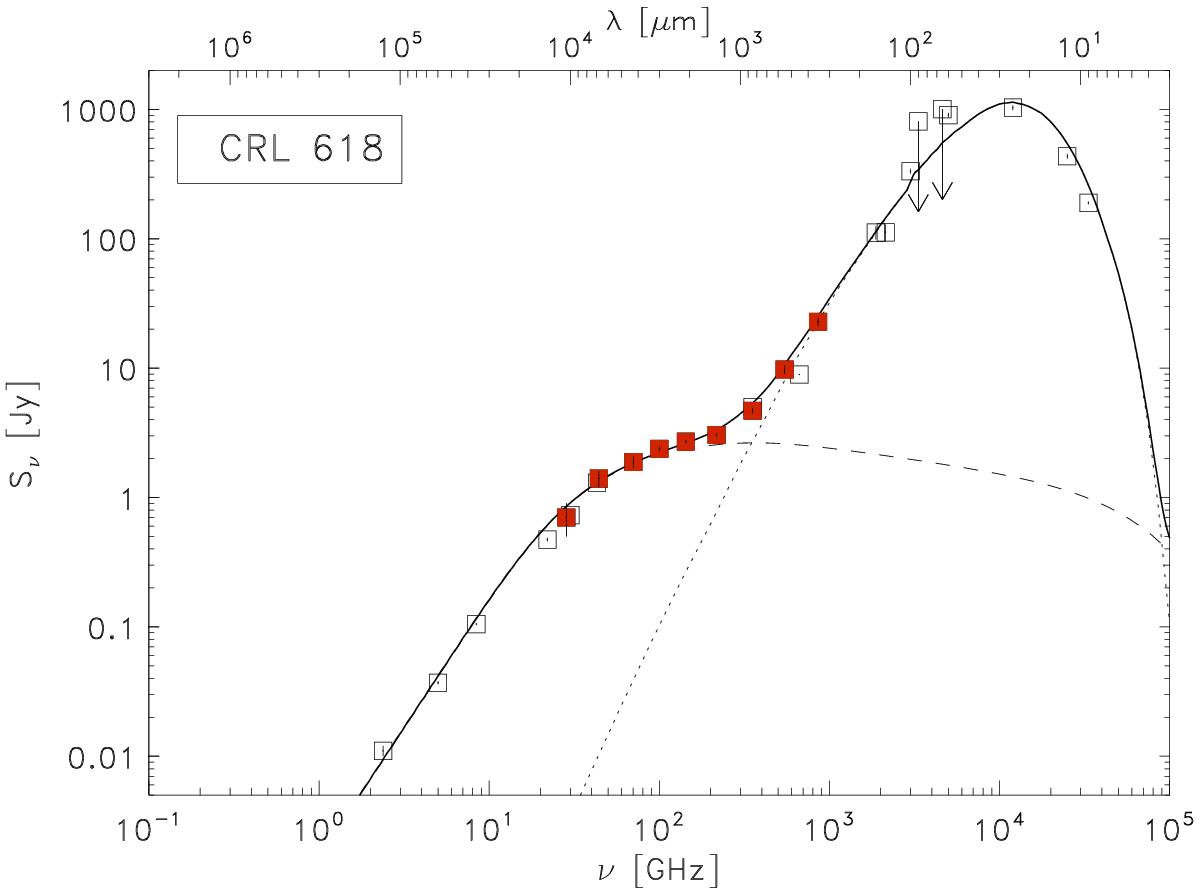
Model of the SED of CRL 618 (continuous line) considering both free-free (dashed line) and thermal dust emission (dotted line). Ancillary measurements, obtained with different instruments (IRAS, Helou & Walker 1988; Akari, Murakami et al. 2007), are shown as open squares, while Planck data are shown as red squares. The arrows indicate upper limits. For the ancillary radio measurements (ν ≤ 40 GHz) only VLA data coeval to Planck observations have been used (see text).
Current usage metrics show cumulative count of Article Views (full-text article views including HTML views, PDF and ePub downloads, according to the available data) and Abstracts Views on Vision4Press platform.
Data correspond to usage on the plateform after 2015. The current usage metrics is available 48-96 hours after online publication and is updated daily on week days.
Initial download of the metrics may take a while.