Fig. 5
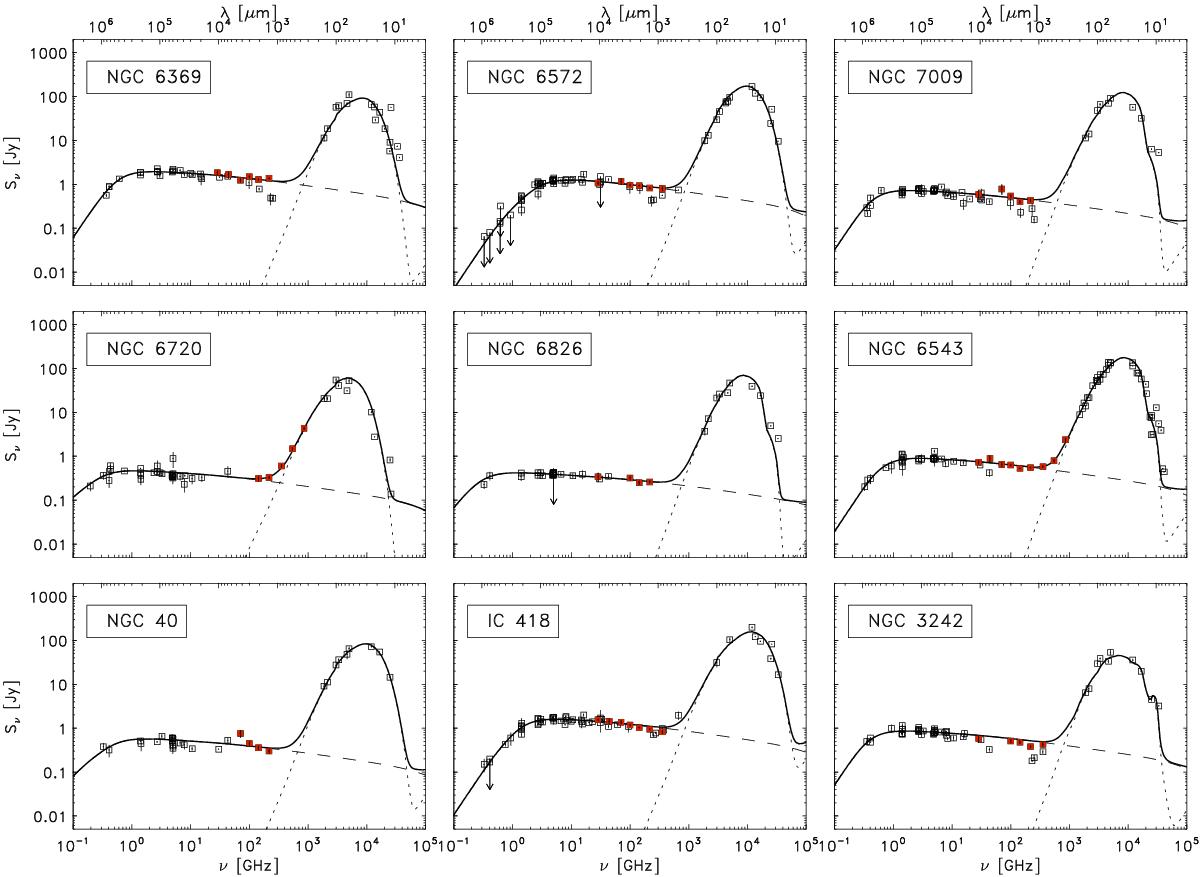
Models of the SEDs for our sample of Galactic PNe. The continuous line is the combination of both free-free (dashed line) and thermal dust emission (dotted line). Measurements obtained with different instruments and collated from the literature are shown as open squares. Planck measurements are indicated by red squares. The arrows indicate upper limits.
Current usage metrics show cumulative count of Article Views (full-text article views including HTML views, PDF and ePub downloads, according to the available data) and Abstracts Views on Vision4Press platform.
Data correspond to usage on the plateform after 2015. The current usage metrics is available 48-96 hours after online publication and is updated daily on week days.
Initial download of the metrics may take a while.