Fig. 4
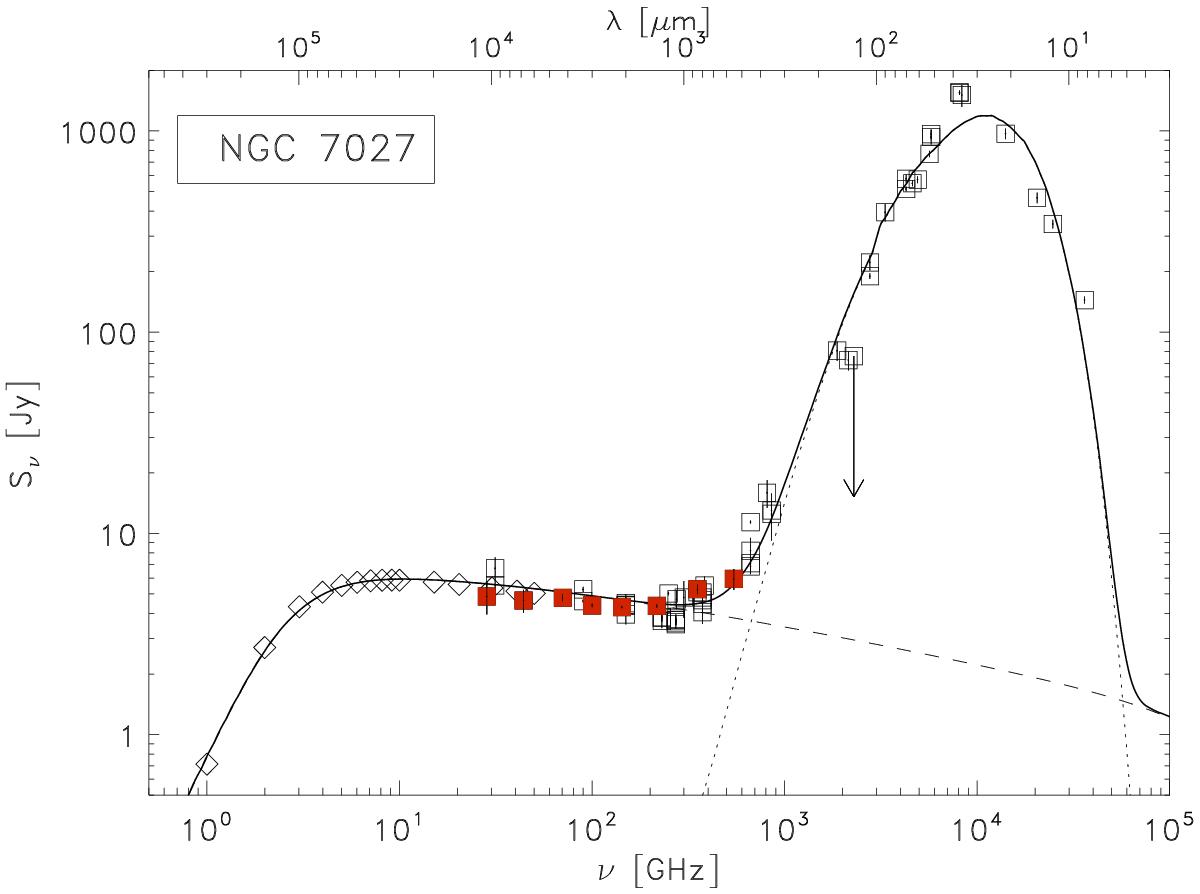
SED of NGC 7027. Ancillary measurements, obtained with different instruments, are shown as open squares, while the Planck data are shown as red squares. The arrows indicate upper limits. The diamonds show the radio spectrum of NGC 7027 given by Zijlstra et al. (2008) and evolved to the mean Planck observing time. The continuous line is the model of the SED, obtained by combining both free-free (dashed line) and thermal dust emission (dotted line).
Current usage metrics show cumulative count of Article Views (full-text article views including HTML views, PDF and ePub downloads, according to the available data) and Abstracts Views on Vision4Press platform.
Data correspond to usage on the plateform after 2015. The current usage metrics is available 48-96 hours after online publication and is updated daily on week days.
Initial download of the metrics may take a while.