Free Access
Fig. 14
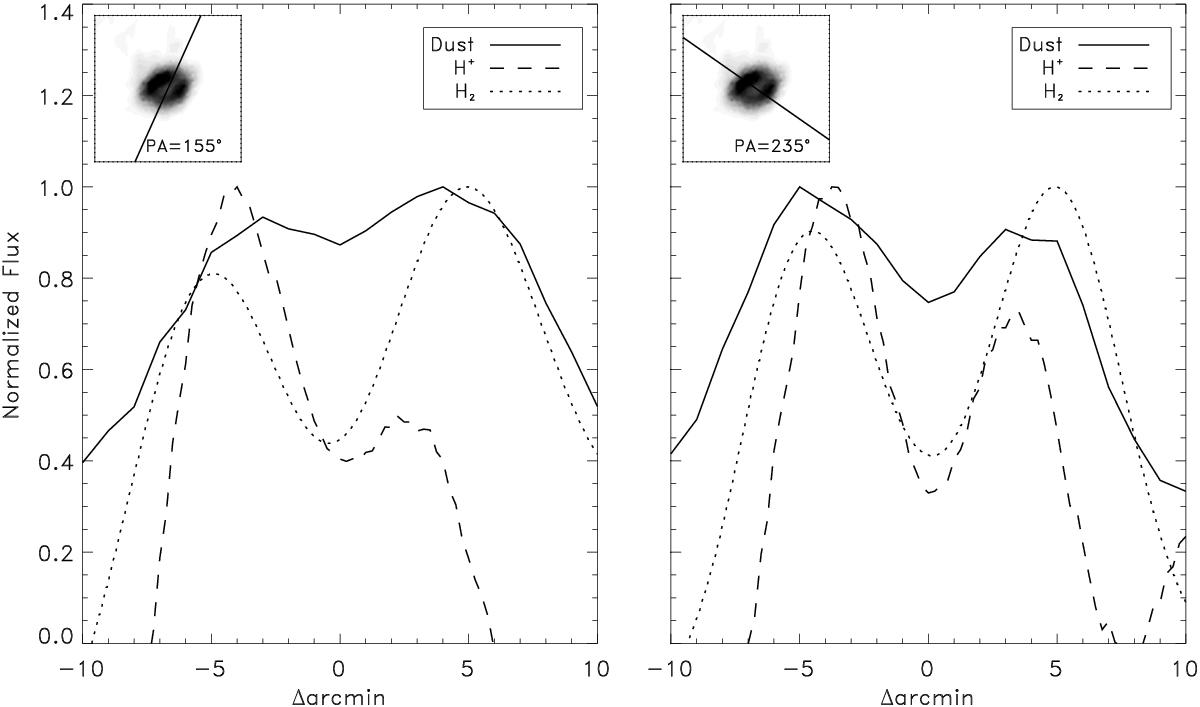
Profiles of the brightness of the dust (Planck at 857 GHz – continuous line), radio (H+, NVSS at 1.4 GHz – dashed line) and H2 (dotted line) components obtained at PA = 155deg (left) and 235deg (right). Profiles have been normalized to the Helix peak of each maps.
Current usage metrics show cumulative count of Article Views (full-text article views including HTML views, PDF and ePub downloads, according to the available data) and Abstracts Views on Vision4Press platform.
Data correspond to usage on the plateform after 2015. The current usage metrics is available 48-96 hours after online publication and is updated daily on week days.
Initial download of the metrics may take a while.