Fig. 8
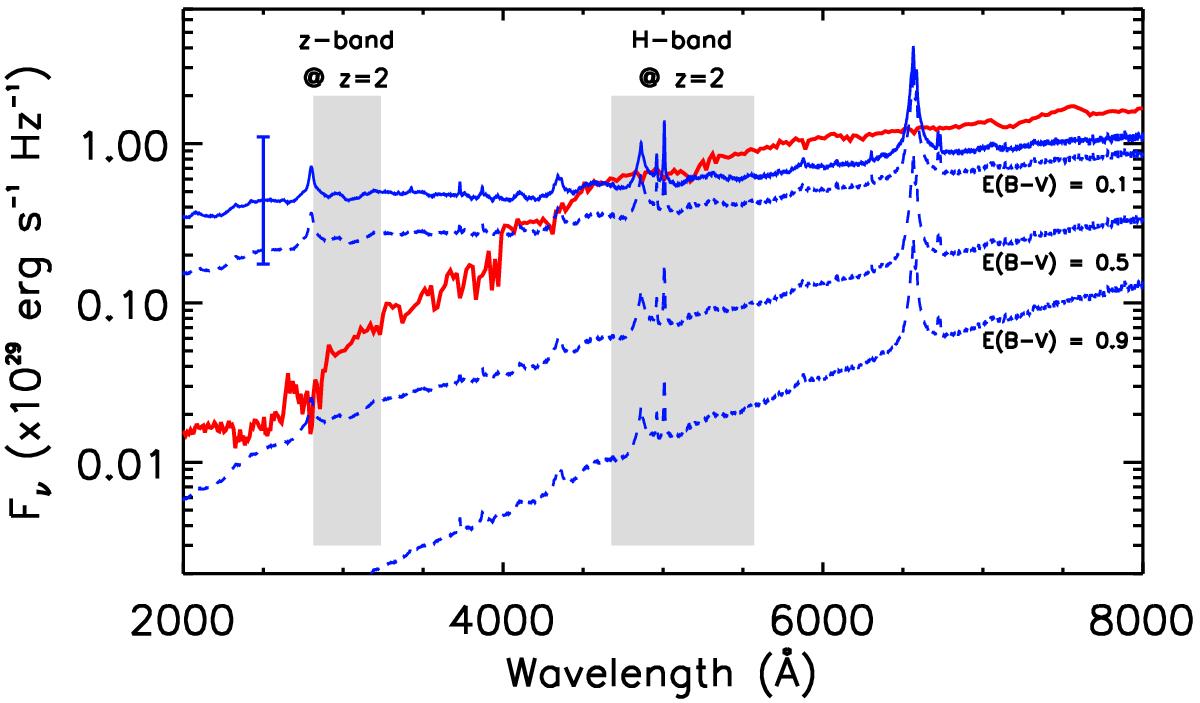
Comparison of a typical galaxy spectrum (red solid line) and AGN spectra with different levels of extinction (blue lines). The base galaxy spectrum is the Sa template from the SWIRE library (Polletta et al. 2007) scaled to correspond to H = 24 mag if placed at z = 2. The base AGN spectrum (blue solid line) is stitched together from composite radio-quiet QSO spectra in the UV from Telfer et al. (2002) and the optical from Vanden Berk et al. (2001), scaled to correspond to LX= 1043.5 erg s-1 using optical/X-ray relation defined by Lusso et al. (2010); the error bars show the expected scatter in the relation. The blue dashed lines show the effects of Calzetti-law extinction on the base AGN spectrum with E(B − V) as indicated on the right below the corresponding extinguished spectrum. The approximate position of the observed F850LP (z) and F160W (H) bands at z = 2, relevant for the interpretation of Fig. 6, are shown as grey bands.
Current usage metrics show cumulative count of Article Views (full-text article views including HTML views, PDF and ePub downloads, according to the available data) and Abstracts Views on Vision4Press platform.
Data correspond to usage on the plateform after 2015. The current usage metrics is available 48-96 hours after online publication and is updated daily on week days.
Initial download of the metrics may take a while.