Fig. 6
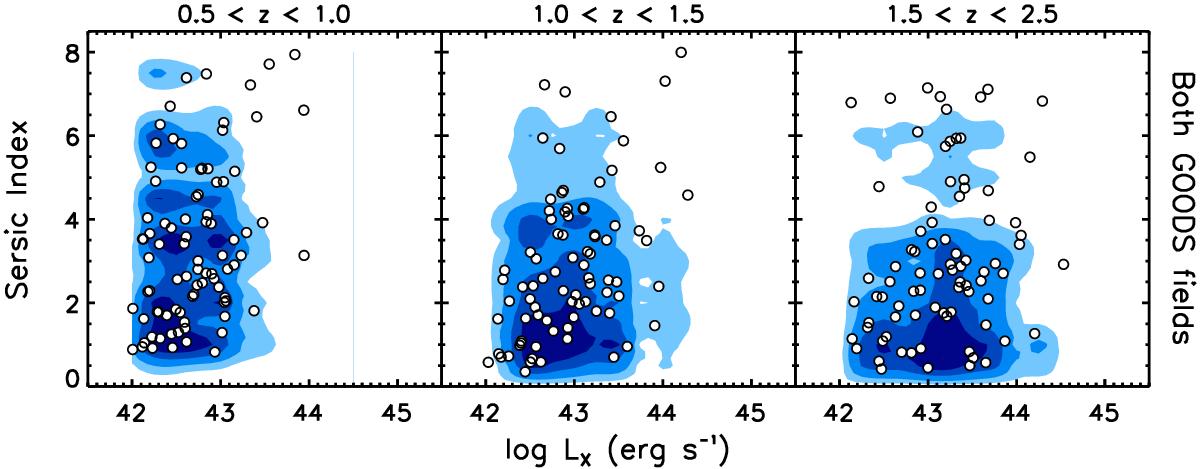
GALFIT-derived Sérsic index vs. absorption-corrected 2−10 keV X-ray luminosity of AGNs from both Chandra Deep Fields combined (white circle points). The contours show the density of points from 1000 draws of a mass-matched control sample of inactive galaxies. To place the control galaxies on this plot, the X-ray luminosity assigned to each control galaxy is that of the AGN to which it is matched, producing, in effect, a large simulated AGN sample with the same mass and X-ray luminosity distributions as the real AGNs. The four contour levels encompass 90%, 75%, 50% and 25% of the simulated AGNs in this plane.
Current usage metrics show cumulative count of Article Views (full-text article views including HTML views, PDF and ePub downloads, according to the available data) and Abstracts Views on Vision4Press platform.
Data correspond to usage on the plateform after 2015. The current usage metrics is available 48-96 hours after online publication and is updated daily on week days.
Initial download of the metrics may take a while.