Fig. 4
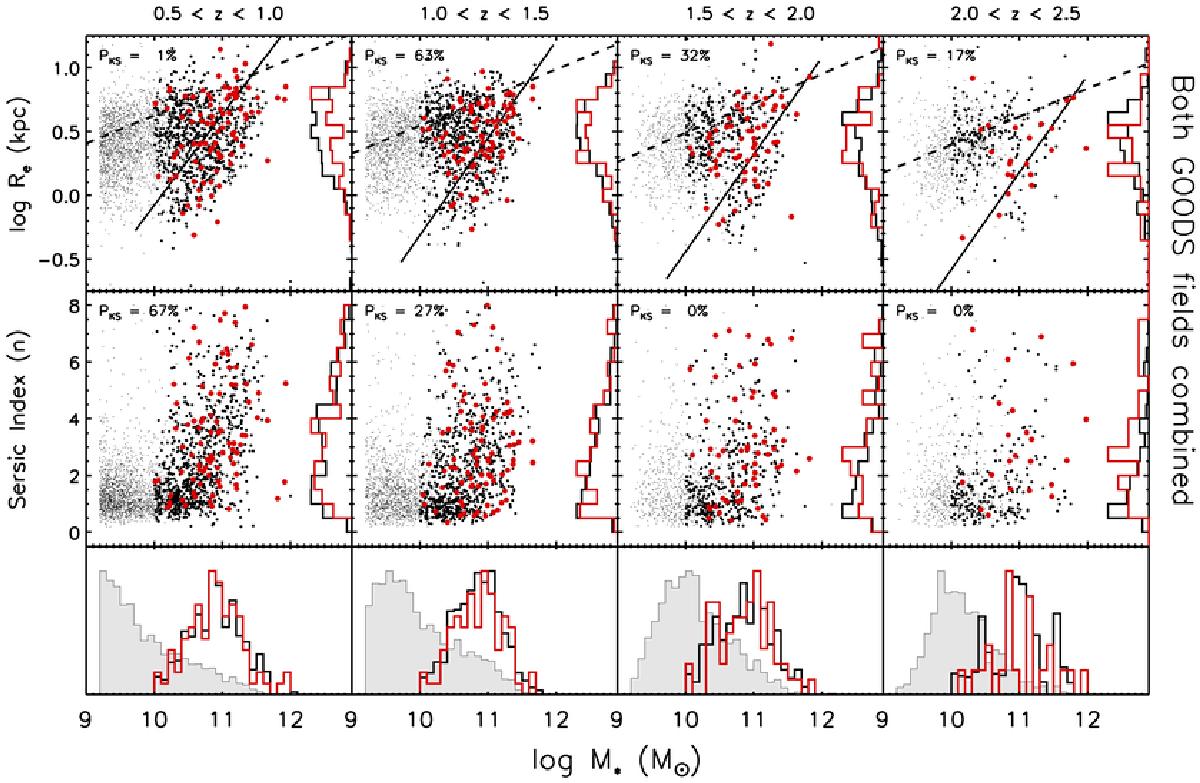
Top panels: physical half-light semi-major axis radii plotted against stellar mass M∗ for AGNs (large red points), inactive control galaxies (large black points) and the overall galaxy population (small grey points), in four distinct redshift bins. Samples from both GOODS fields are combined and one hundred control sample draws are used in all panels of this figure. The lines in the upper panels show parameterizations of galaxy size-mass relationships across redshift from van der Wel et al. (2014); dashed lines for late-type galaxies and solid lines for early type galaxies. Vertical histograms compare the size distributions of the AGNs (red lines) and the inactive control. Middle panels: Sérsic index n plotted against stellar mass M∗ for AGNs (large red points), inactive control galaxies (large black points) and the overall galaxy population (small grey points), in four distinct redshift bins. Samples from both GOODS fields are combined here. Vertical histograms compare the size distributions of the AGNs (red lines) and the inactive control. In each panel in both rows, the Kolmogorov-Smirnoff (KS) probability (PKS) that the vertical distributions come from the same parent sample is shown in the upper left corner. Bottom panels: a comparison of the M∗ distributions of AGNs (red histograms), the inactive control sample (black histograms) and the overall galaxy population (grey filled histograms). The importance of stellar mass-matching in constructing a valid comparison sample is clear, and the performance of our mass-matching procedure may be appreciated at a glance.
Current usage metrics show cumulative count of Article Views (full-text article views including HTML views, PDF and ePub downloads, according to the available data) and Abstracts Views on Vision4Press platform.
Data correspond to usage on the plateform after 2015. The current usage metrics is available 48-96 hours after online publication and is updated daily on week days.
Initial download of the metrics may take a while.