Fig. 14
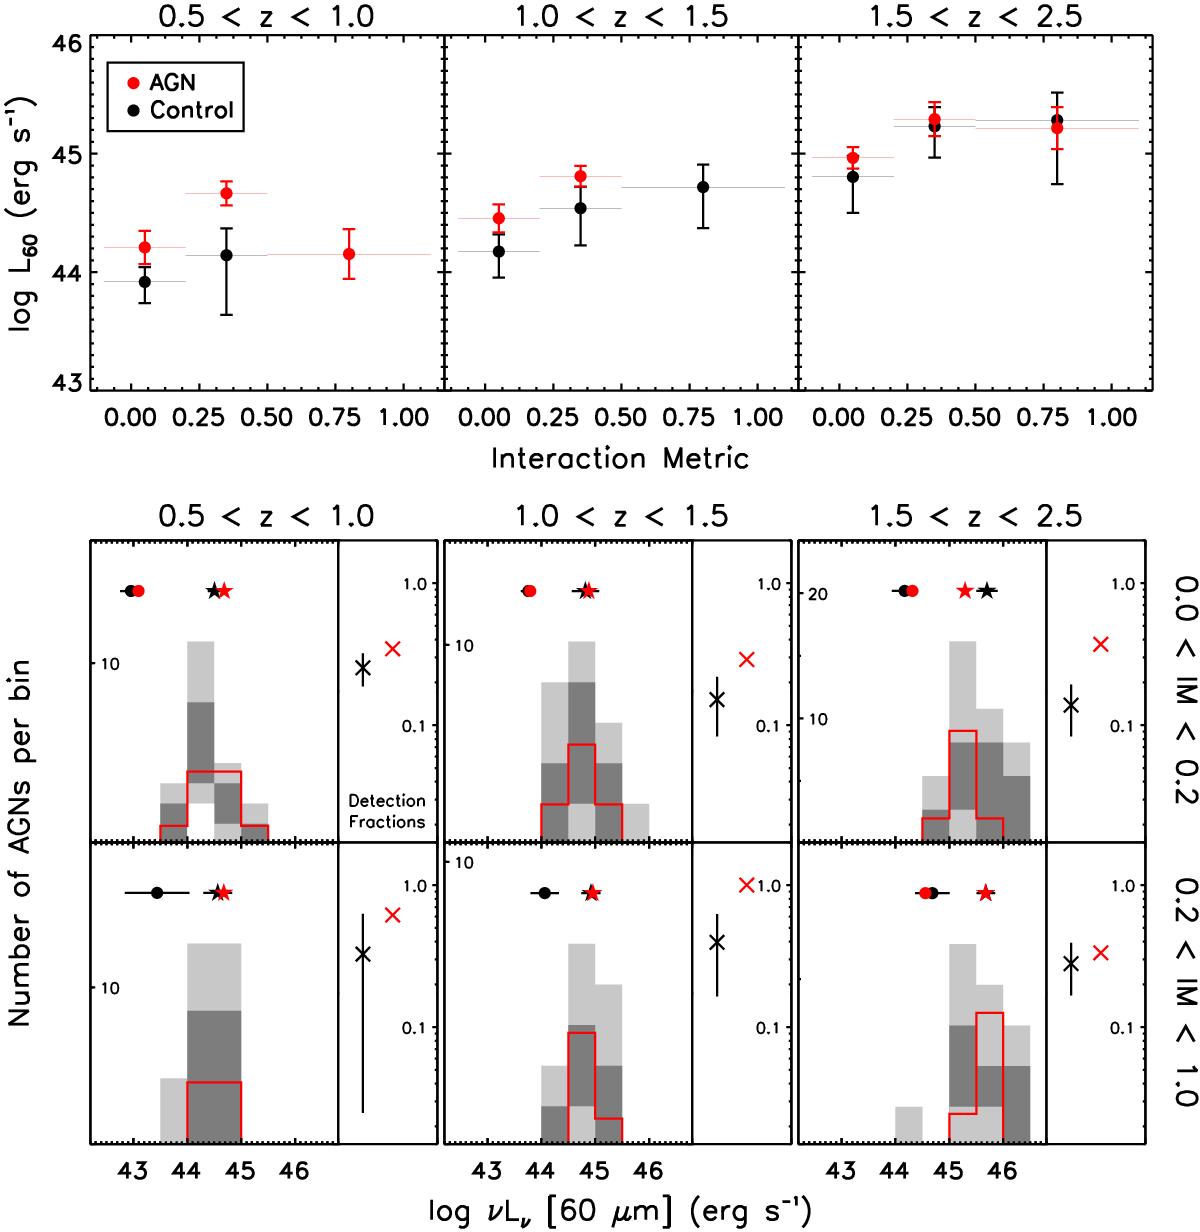
Mean 60 μm monochromatic luminosities (L60) and luminosity distributions of AGNs and inactive control galaxies in GOODS-S, as a function of visual Interaction Metric (IM). Panels left to right span three distinct bins in redshift. In the top row, the mean L60 from combinations of detections and stacks are compared in bins of IM. In the lower two rows, each panel is split into two subpanels. L60 distributions and PACS detection fractions for AGNs and inactive galaxies are plotted in the left subpanels for two coarse bins in IM. PACS detection fractions are shown in the right subpanels. Details of the plot are identical to those of Fig. 13, except for a difference in the structural measure. See Sect. 4.2 for a discussion.
Current usage metrics show cumulative count of Article Views (full-text article views including HTML views, PDF and ePub downloads, according to the available data) and Abstracts Views on Vision4Press platform.
Data correspond to usage on the plateform after 2015. The current usage metrics is available 48-96 hours after online publication and is updated daily on week days.
Initial download of the metrics may take a while.