Fig. 13
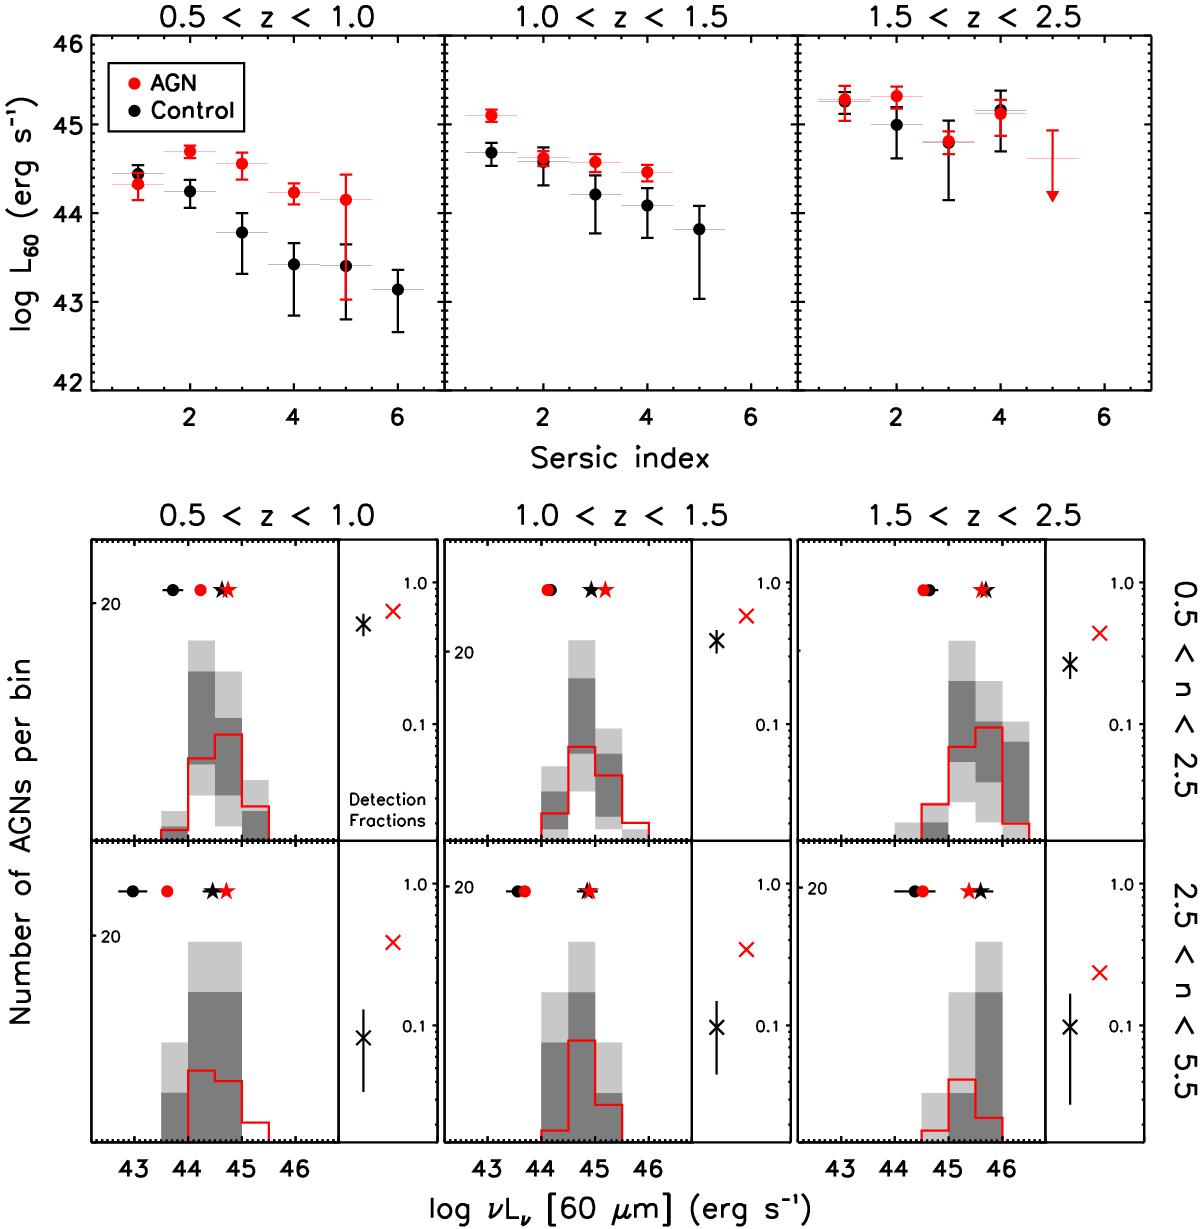
Mean 60 μm monochromatic luminosities (L60) and luminosity distributions of AGNs and inactive control galaxies in both GOODS fields combined, as a function of H-band Sérsic index (n). Panels left to right span three distinct bins in redshift. In the top row, the mean L60 from combinations of detections and stacks are compared in bins of n. The X-axis error bars show the extent of these bins. The errors on the AGN measurements (red points) are determined from bootstrapping into the AGN subsample in each bin in redshift and n. The errors on the inactive galaxy measurements (black points) come from the analysis of an ensemble of mean L60 from 100 random draws of mass-matched control galaxies. In the lower two rows, each panel is split into two subpanels. L60 distributions and PACS detection fractions for AGNs and inactive galaxies are plotted in the left subpanels for two coarse bins in Sérsic index. Histograms show the L60 distributions of PACS-detected AGNs and inactive galaxies. The 100 random draws of mass-matched control galaxies are used to determine the 1σ/2σ scatter in L60 for inactive galaxies, shown as dark/light grey zones in the histograms. The red histograms are the L60 distributions for AGNs. The mean L60 corresponding to these histograms are plotted for PACS-detected AGNs as red star points and for inactive galaxies as black star points. Error bars on the latter are the rms scatter of the mean of the control samples. The mean L60 of PACS-undetected AGNs (red circle points) and inactive galaxies (black circle points) are also compared similarly. PACS detection fractions are shown in the right subpanels. Red cross points denote AGNs and black cross points denote inactive galaxies, with rms scatter shown as vertical error bars on the latter points. See Sect. 4.1 for a discussion.
Current usage metrics show cumulative count of Article Views (full-text article views including HTML views, PDF and ePub downloads, according to the available data) and Abstracts Views on Vision4Press platform.
Data correspond to usage on the plateform after 2015. The current usage metrics is available 48-96 hours after online publication and is updated daily on week days.
Initial download of the metrics may take a while.