Fig. 12
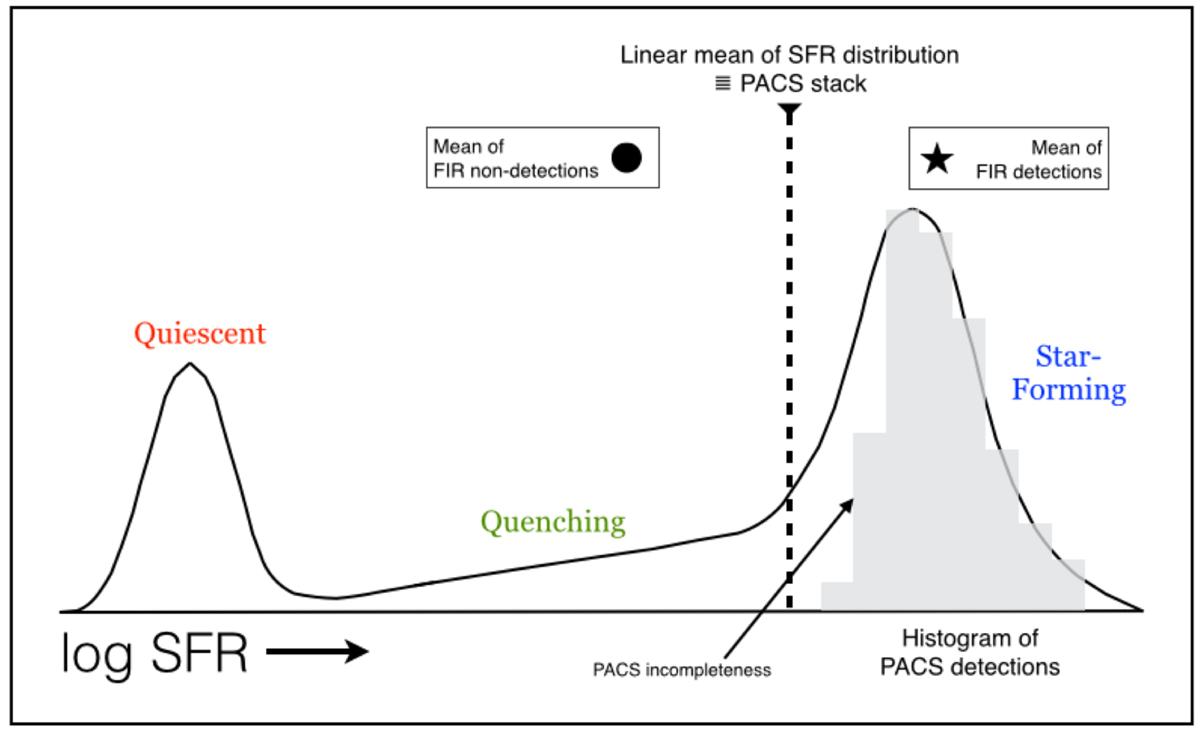
An illustration useful for understanding Figs. 13–15. The solid curve shows a qualitative schematic SFR distribution of a population of galaxies, for example, massive galaxies at z ~ 2 where SF galaxies outnumber the quiescent population. It is assumed that the L60 distribution is identical and tracks the SFR. The measurable L60 (or SFR) distribution of galaxies individually detected in the Herschel/PACS maps is shown as a representative grey histogram. At these redshifts, the PEP+GOODS-Herschel PACS catalogs are sensitive to FIR luminosities that trace just deeper than the ridgeline of the SF Sequence (e.g., Rosario et al. 2013b), but the completeness of the catalogs at this limit is low (≈30%) leading to a shallow cutoff in the histogram at the faint end. The mean L60 of the entire population comes from stacks into the PACS maps (see Sect. 2.2) and is shown as a dashed vertical line. Since stacking is a purely linear process, the mean is shifted towards the star-forming end in this diagram. Additionally, the mean L60 of both PACS detected and undetected galaxies can be determined, shown as a star and circle point as in the later figures. The schematic also reveals how the fraction of galaxies that are FIR-detected is closely related to the fraction of moderate and strongly SF galaxies in the population.
Current usage metrics show cumulative count of Article Views (full-text article views including HTML views, PDF and ePub downloads, according to the available data) and Abstracts Views on Vision4Press platform.
Data correspond to usage on the plateform after 2015. The current usage metrics is available 48-96 hours after online publication and is updated daily on week days.
Initial download of the metrics may take a while.