Fig. 11
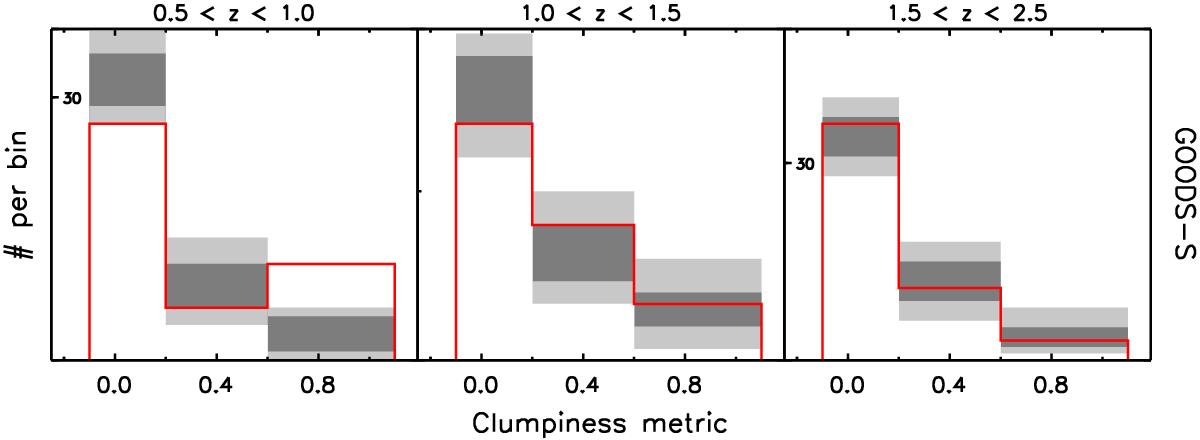
Distributions of the visual Clumpiness Metric (CM) for AGNs and inactive control galaxies. Panels left to right span three distinct bins in redshift. 1000 draws of a mass-matched control sample are analyzed to determine the 1σ/2σ scatter in the CM distributions for inactive galaxies, shown as dark/light grey zones in the histograms. Red open histograms show the parameter distributions for the AGNs. Visually clumpy systems are a minor fraction of galaxies and AGNs at all redshifts. At 0.5 <z< 1.0, AGNs are significantly more likely to be in clumpy galaxies. By 1.5 <z< 2.5, the CM distributions are similar.
Current usage metrics show cumulative count of Article Views (full-text article views including HTML views, PDF and ePub downloads, according to the available data) and Abstracts Views on Vision4Press platform.
Data correspond to usage on the plateform after 2015. The current usage metrics is available 48-96 hours after online publication and is updated daily on week days.
Initial download of the metrics may take a while.