Fig. 47
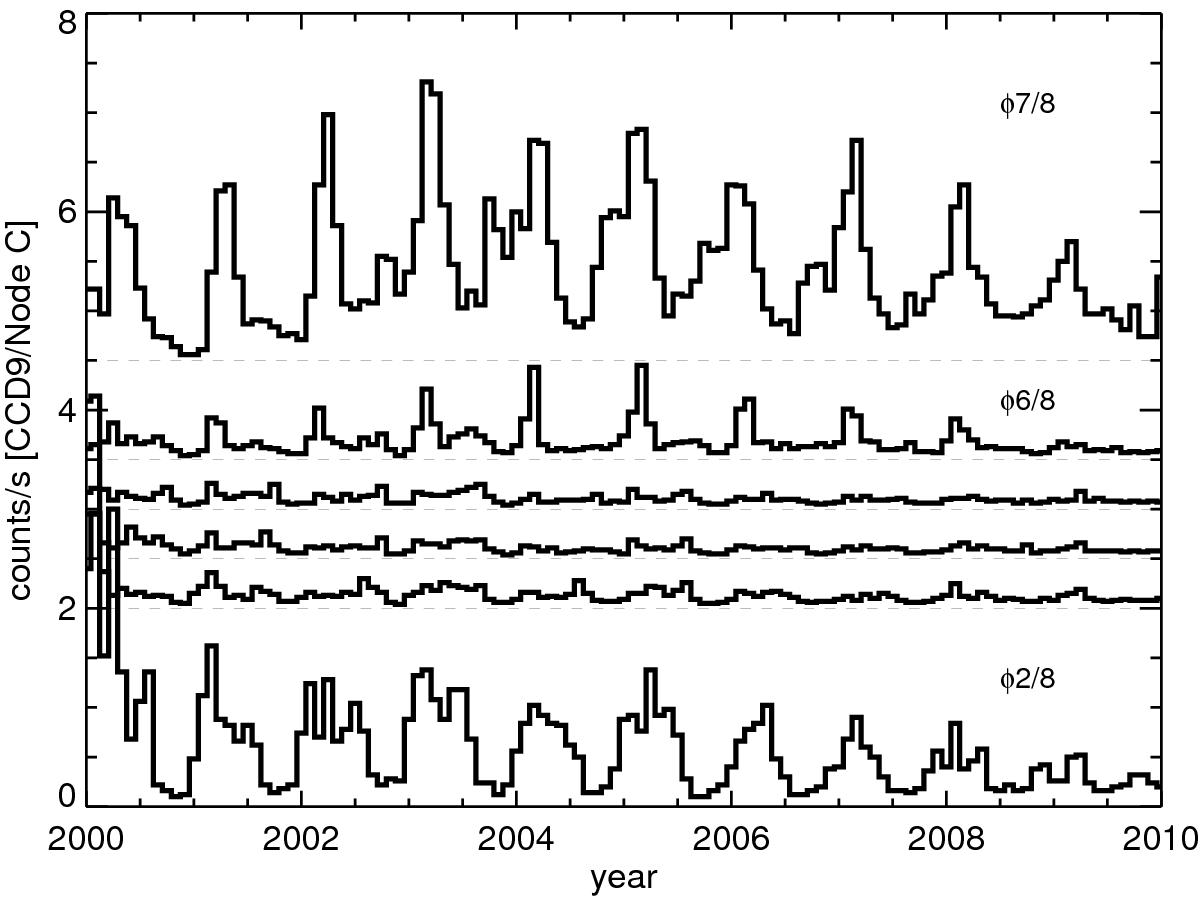
Seasonal variations in the instrument background in counts per second on node C of CCD9, as function of orbit. The different phases of the orbit are shown from bottom to top with a different offset for clarity (indicated by the dashed lines). The phases for the perigee passage are omitted (1/8 and 8/8). The others are shown for increasing phase (bottom to top; for clarity the labels of phases 3/8 to 5/8 are left out). The large scale trend of increasingly smaller maxima in later years, shows the decreasing solar activity over the 11 year solar cycle.
Current usage metrics show cumulative count of Article Views (full-text article views including HTML views, PDF and ePub downloads, according to the available data) and Abstracts Views on Vision4Press platform.
Data correspond to usage on the plateform after 2015. The current usage metrics is available 48-96 hours after online publication and is updated daily on week days.
Initial download of the metrics may take a while.