Fig. 39
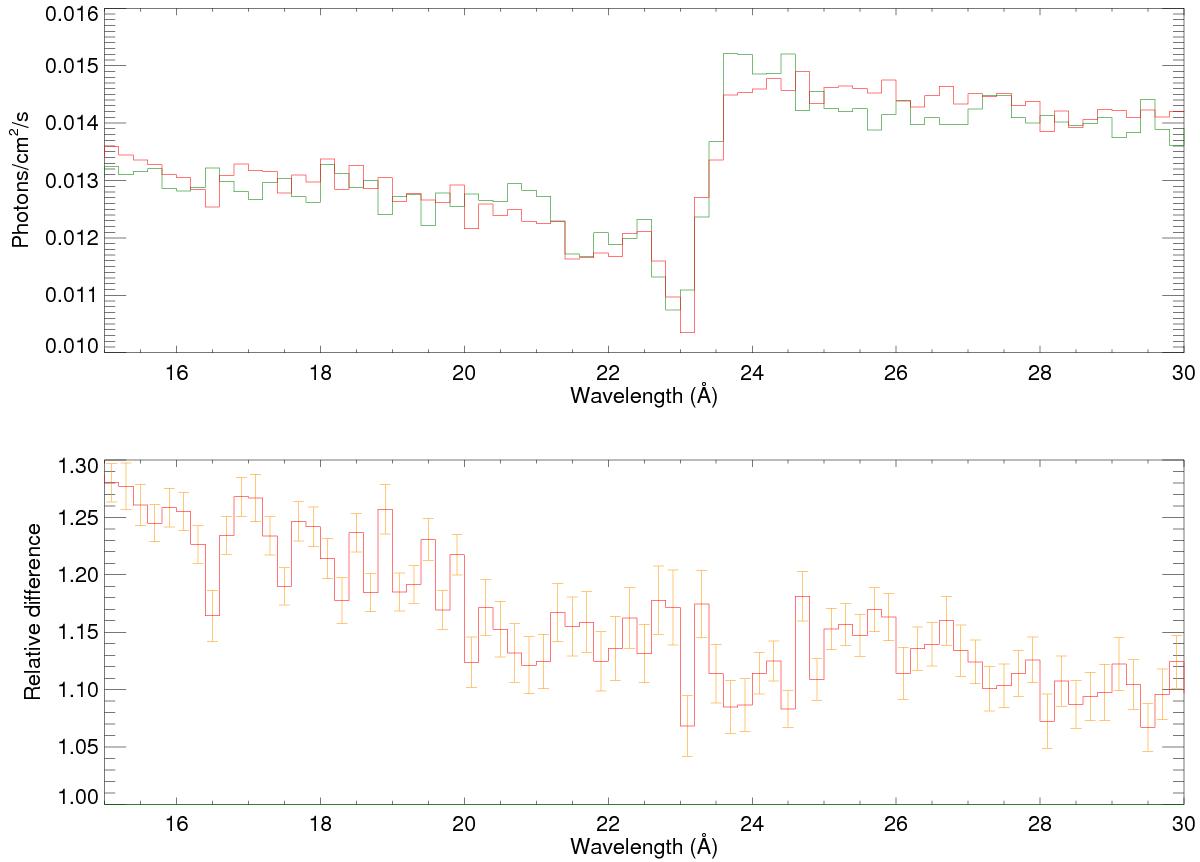
Stability of the instrumental oxygen edge: comparison of spectra corrected for a change in slope and normalization (top) and ratio (bottom) of Mrk 421 data in orbit 84 (red) and orbit 2002 (green). The spectra show the uncorrected instrumental edge, which is normally corrected for during default data processing. The slight linear trend in the relative difference plot (bottom) is caused by small changes in the source power law spectrum over time.
Current usage metrics show cumulative count of Article Views (full-text article views including HTML views, PDF and ePub downloads, according to the available data) and Abstracts Views on Vision4Press platform.
Data correspond to usage on the plateform after 2015. The current usage metrics is available 48-96 hours after online publication and is updated daily on week days.
Initial download of the metrics may take a while.