Fig. 33
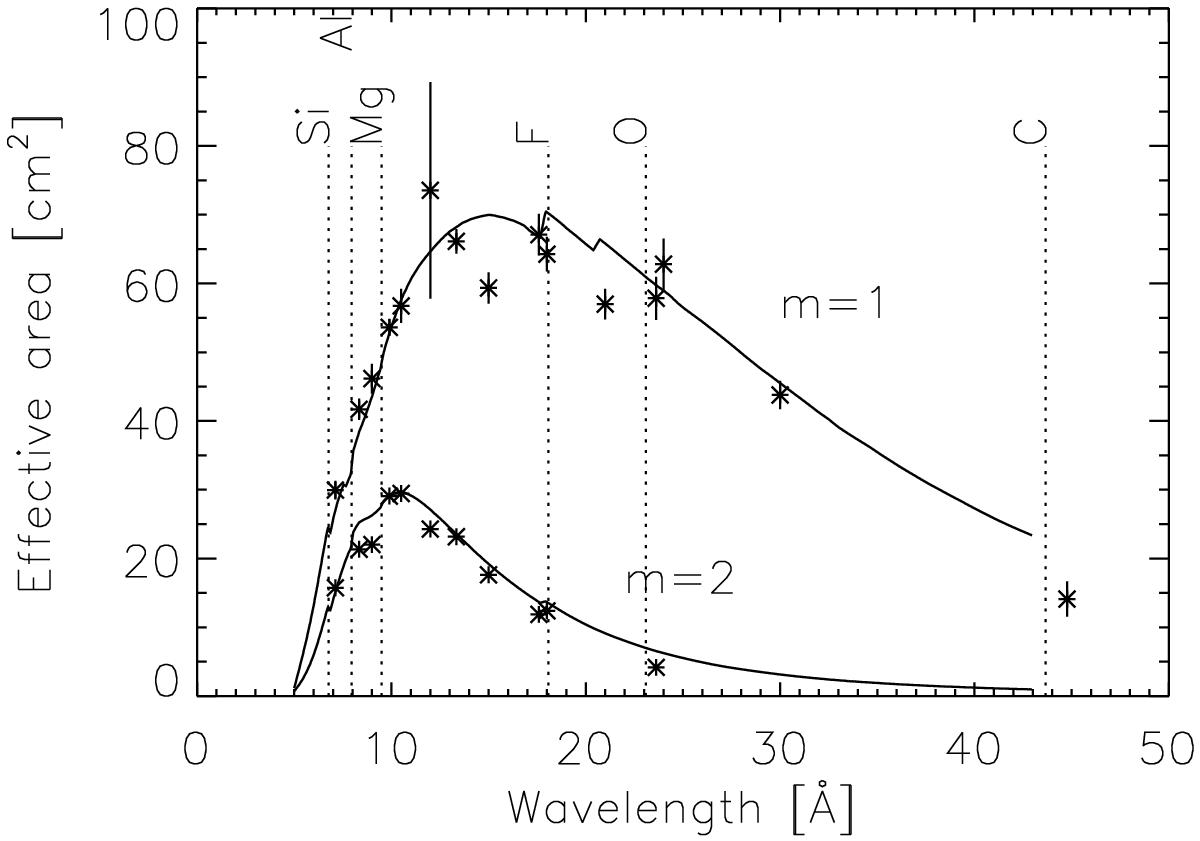
Effective area verified preflight by end-to-end measurements at the Panter facility (den Herder et al. 2001). This can be compared with the measured in flight effective area as verified on celestial sources (Fig. 34). The model is indicated by the solid line. Sharp features are caused by either atomic absorption edges or differences between different CCD Al layers. The broken lines indicate the relevant atomic edges. The asterisk symbols show the measured data points.
Current usage metrics show cumulative count of Article Views (full-text article views including HTML views, PDF and ePub downloads, according to the available data) and Abstracts Views on Vision4Press platform.
Data correspond to usage on the plateform after 2015. The current usage metrics is available 48-96 hours after online publication and is updated daily on week days.
Initial download of the metrics may take a while.