Fig. 31
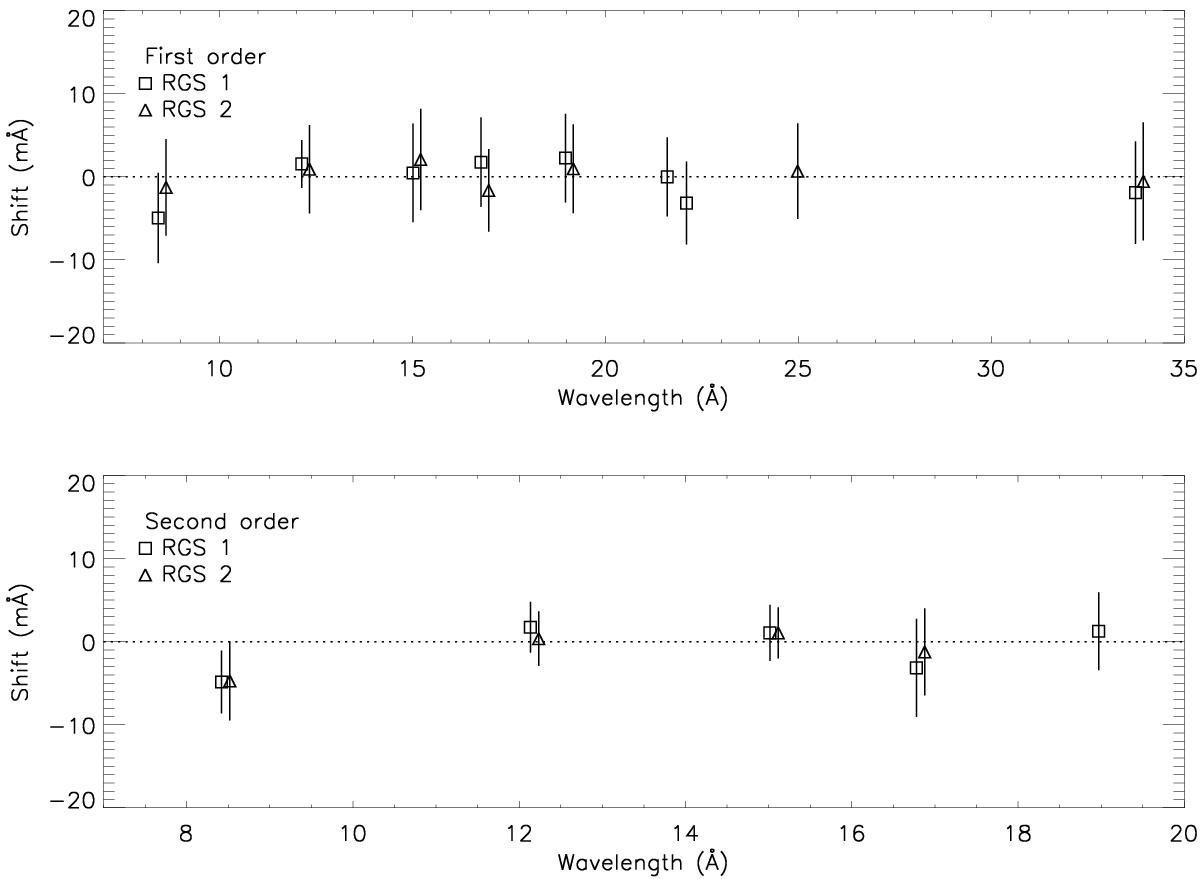
Difference between expected and observed wavelengths as a function of expected wavelengths for RGS1 (squares) and RGS2 (triangles). RGS2 data have been slightly (horizontally) displaced for clarity. Error bars are the standard deviations of the statistics of the line fits. The spread of the data points seems somewhat smaller than the error bars indicate. There is a possibility this is due to correlations between spectral bins because of rebinning of the original CCD pixels, which might cause the statistical error to be somewhat overestimated.
Current usage metrics show cumulative count of Article Views (full-text article views including HTML views, PDF and ePub downloads, according to the available data) and Abstracts Views on Vision4Press platform.
Data correspond to usage on the plateform after 2015. The current usage metrics is available 48-96 hours after online publication and is updated daily on week days.
Initial download of the metrics may take a while.