Free Access
Fig. 30
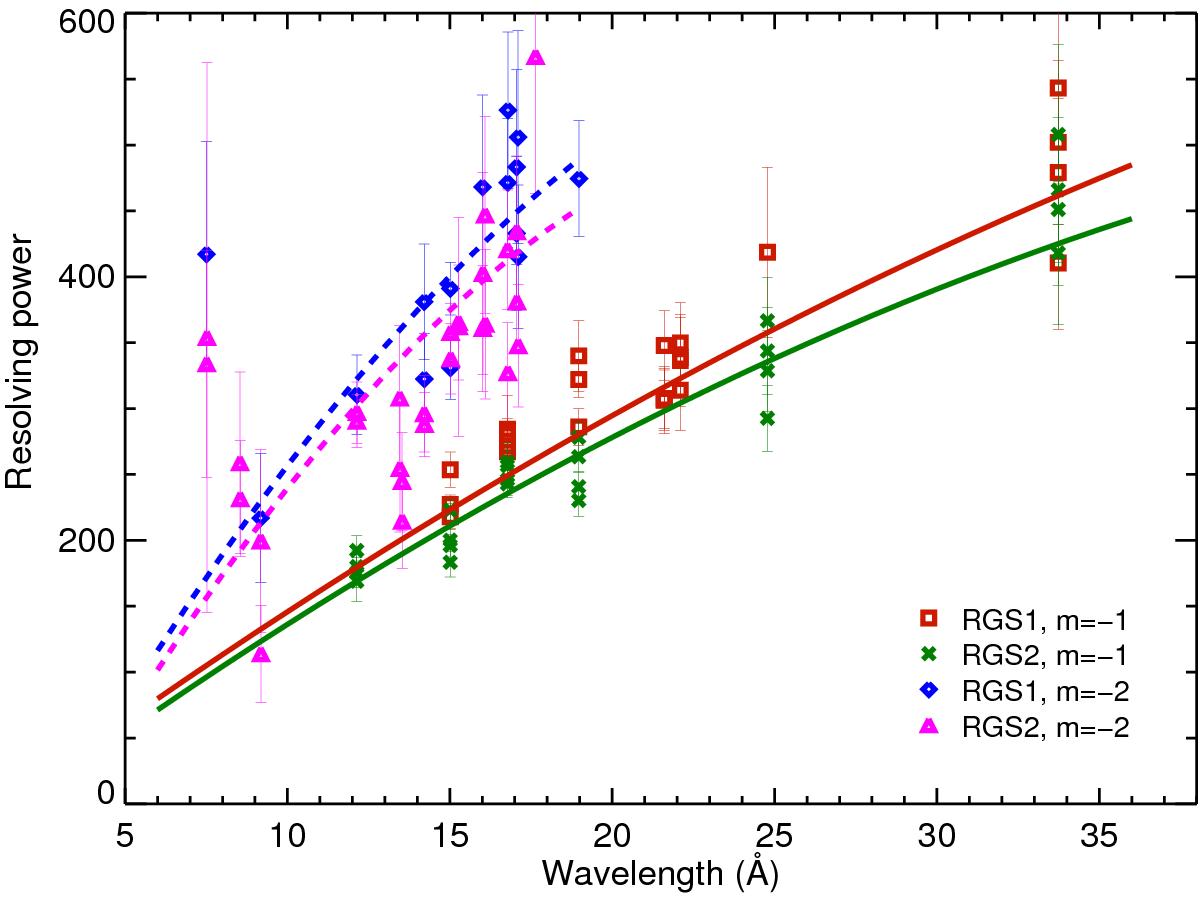
Resolving power for RGS1 and RGS2 implemented in the calibration given by the response matrix (lines), and measured from individual line profiles (points), showing the spread around the model, and demonstrating that the line widths follow the trends defined by the physical model of the instrument.
Current usage metrics show cumulative count of Article Views (full-text article views including HTML views, PDF and ePub downloads, according to the available data) and Abstracts Views on Vision4Press platform.
Data correspond to usage on the plateform after 2015. The current usage metrics is available 48-96 hours after online publication and is updated daily on week days.
Initial download of the metrics may take a while.