Free Access
Fig. 27
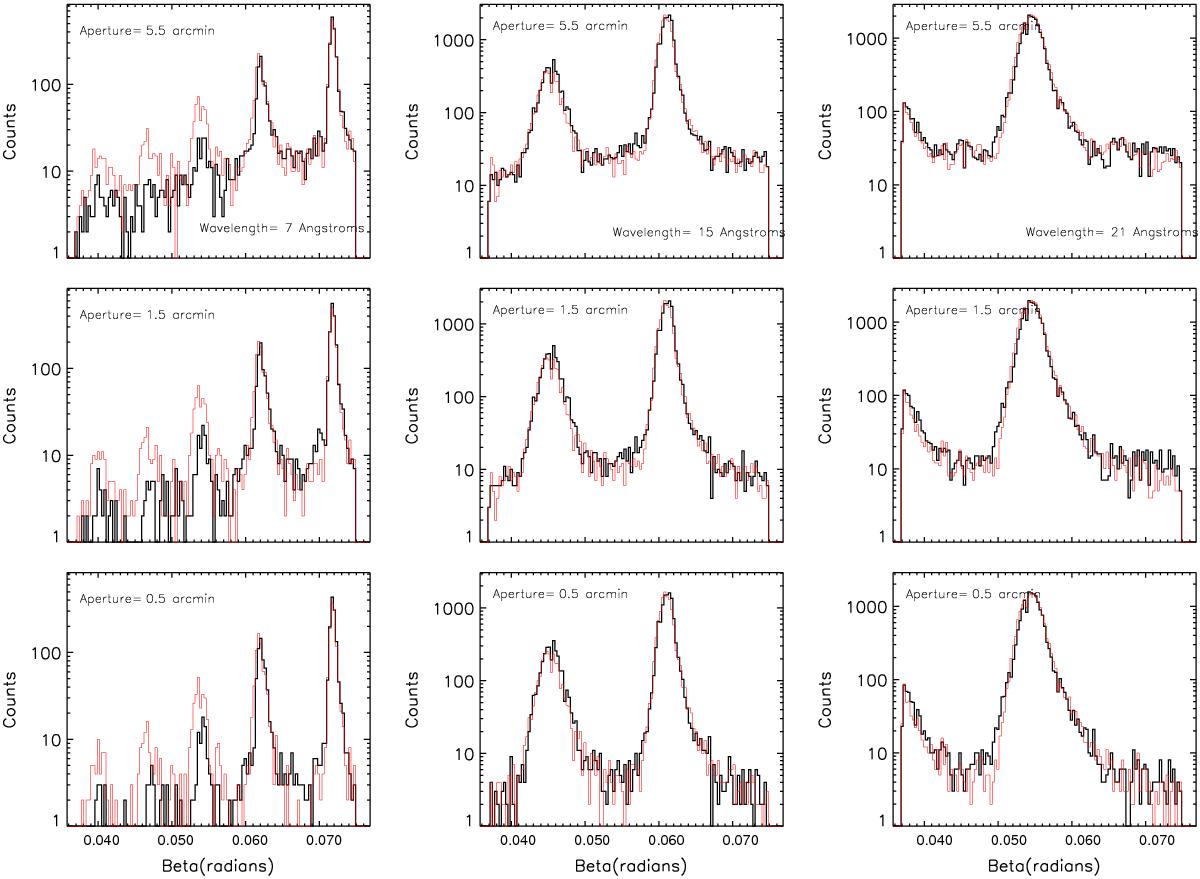
Comparison of modeled response (red line) with observations (black line) for different cross dispersion apertures (ranging from 0.5 to 5.5 arcmin, bottom to top), shown as intensities versus dispersion angle (Beta) for different CCD pulse height selections (columns left to right) at 7, 15 and 21 Å, or 1.7, 0.8 and 0.6 keV.
Current usage metrics show cumulative count of Article Views (full-text article views including HTML views, PDF and ePub downloads, according to the available data) and Abstracts Views on Vision4Press platform.
Data correspond to usage on the plateform after 2015. The current usage metrics is available 48-96 hours after online publication and is updated daily on week days.
Initial download of the metrics may take a while.