Fig. 2
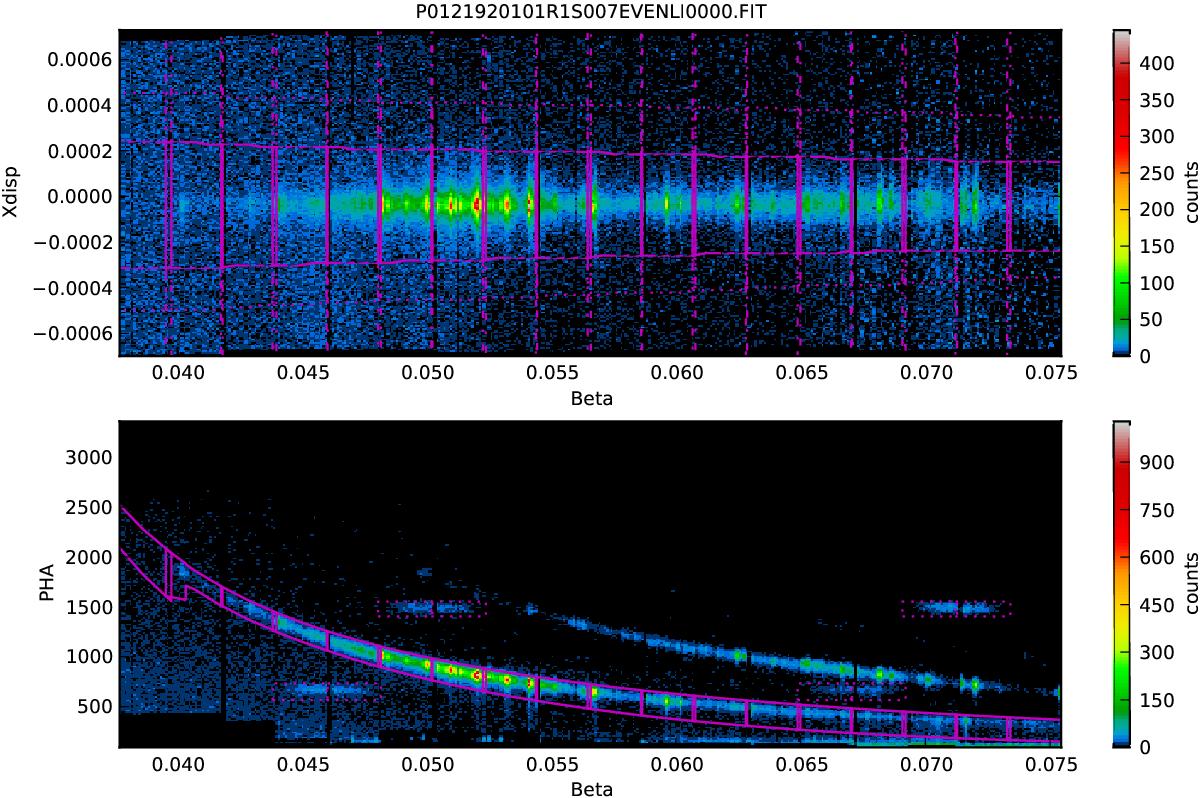
Capella observation (id: 0121500201001). The color scale represents a logarithmic intensity scale. The dispersion (Beta) axis runs horizontally and increases to the right. All angles (Beta, Xdisp) are in radians. In the top panel the cross dispersion (Xdisp) is along the vertical axis whereas in the bottom panel this is replaced by the CCD recorded photon energy, or PHA, in units of eV. In the bottom panel the low level thresholds are clearly visible. Standard data selections for first order are indicated by the solid purple curves.
Current usage metrics show cumulative count of Article Views (full-text article views including HTML views, PDF and ePub downloads, according to the available data) and Abstracts Views on Vision4Press platform.
Data correspond to usage on the plateform after 2015. The current usage metrics is available 48-96 hours after online publication and is updated daily on week days.
Initial download of the metrics may take a while.