Fig. 17
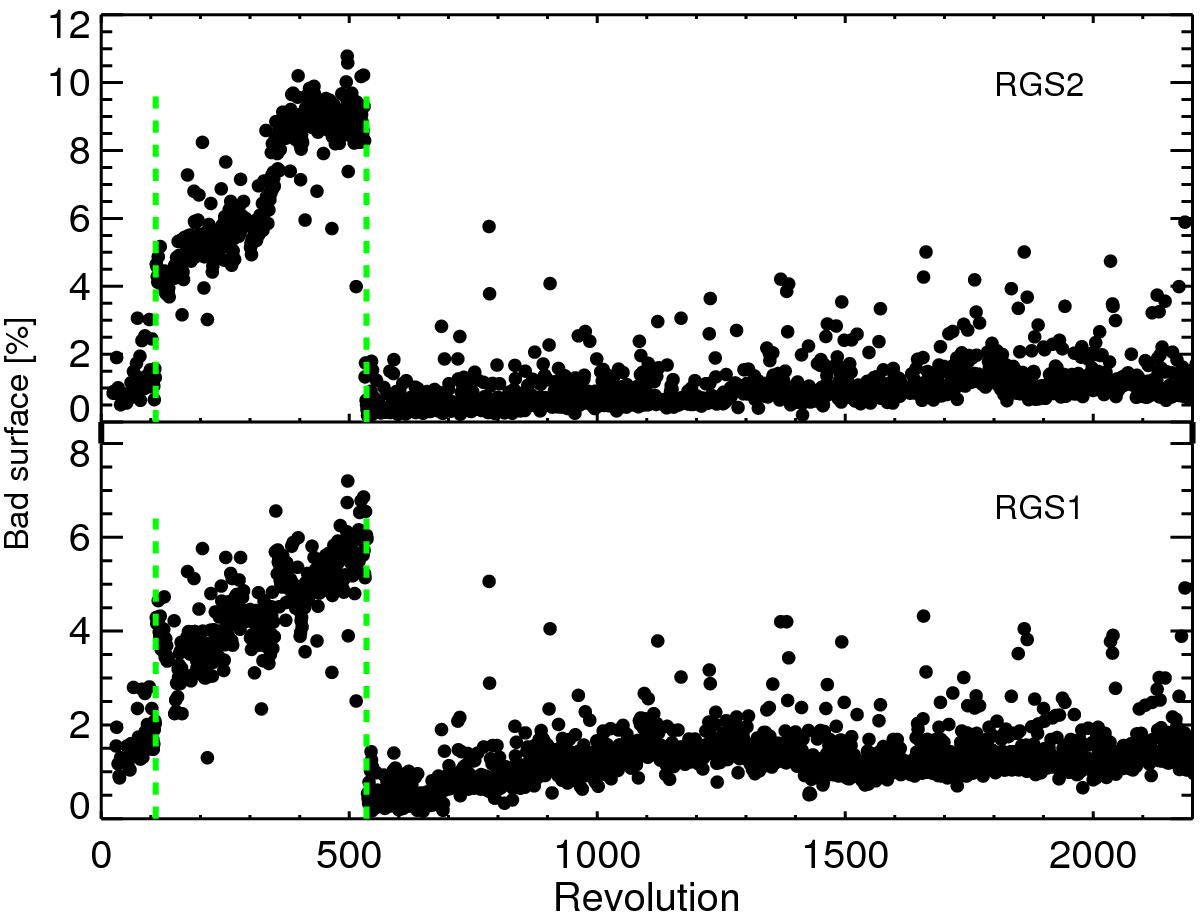
Bad area per detector as detected by the standard monitoring tools. The first increase corresponds to a major solar flare in orbit 110, the drop around orbit 535 is due to the cooling of the detectors from − 80 °C to − 110 °C. Individual outliers are due to peculiar observational circumstances, like e.g. periods of very high background, observations of very bright sources, or very short observations.
Current usage metrics show cumulative count of Article Views (full-text article views including HTML views, PDF and ePub downloads, according to the available data) and Abstracts Views on Vision4Press platform.
Data correspond to usage on the plateform after 2015. The current usage metrics is available 48-96 hours after online publication and is updated daily on week days.
Initial download of the metrics may take a while.